
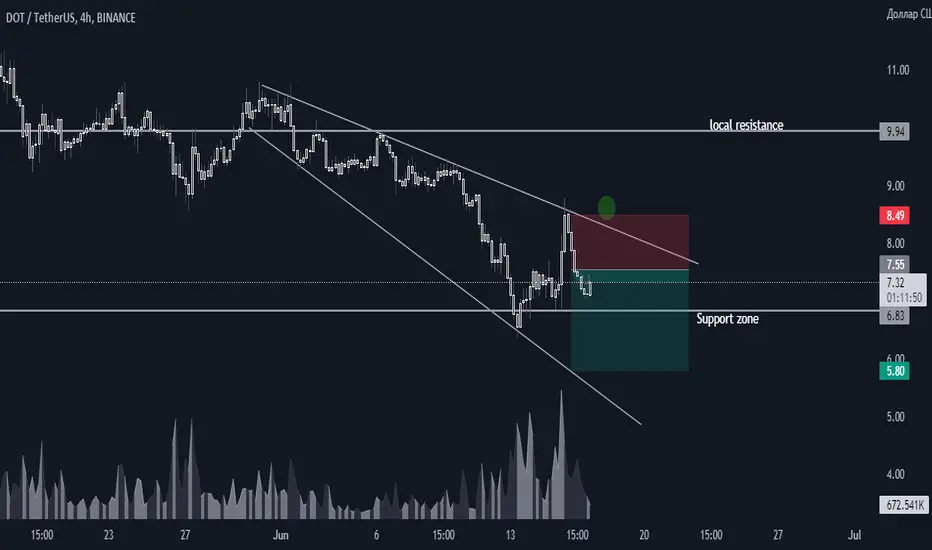
Let's break down polcadot
The price on the chart on the hourly TF 4H shows us a "descending expanding wedge" pattern, at the moment the asset is moving towards the support zone, in case of breakdown, the price will most likely continue to move towards the lower border of the wedge.
Sample plan:
💡Entry point 7.55
🔝Take-profit 6.40
✖️Stop-loss 8.55
✅Don't forget to visit the channel there is a lot of useful information about trading.
✅Write your comments what you think about this coin.

免責聲明
這些資訊和出版物並非旨在提供,也不構成TradingView提供或認可的任何形式的財務、投資、交易或其他類型的建議或推薦。請閱讀使用條款以了解更多資訊。
免責聲明
這些資訊和出版物並非旨在提供,也不構成TradingView提供或認可的任何形式的財務、投資、交易或其他類型的建議或推薦。請閱讀使用條款以了解更多資訊。