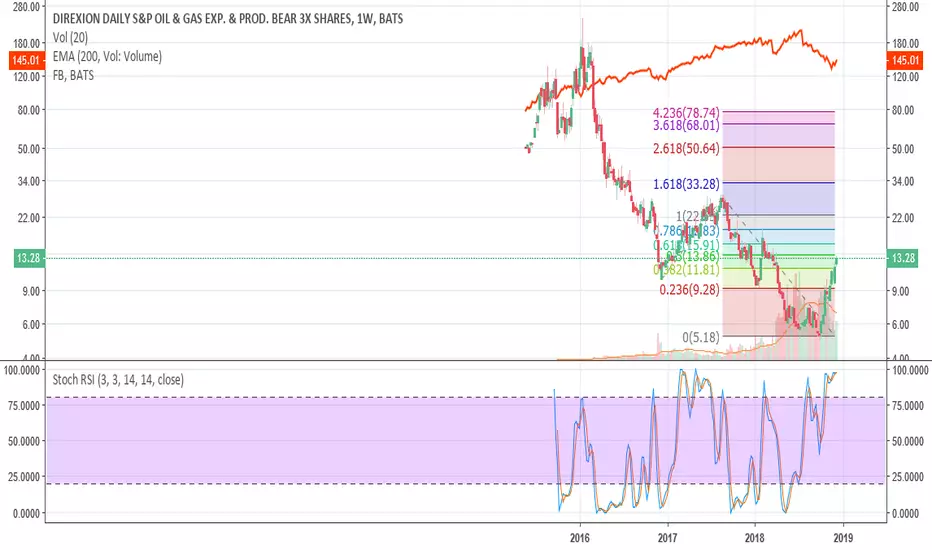
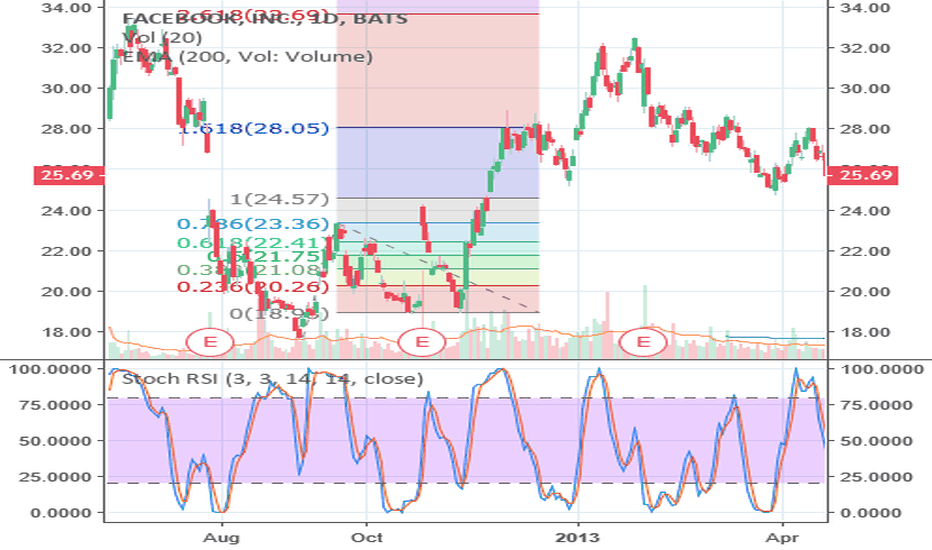
Please see attached similarities between RSI and market movements in early 2013 IPO of Facebook  FB, and early market movements of $DRIP. I see long term weakness in S&P500, till mid 2019 at least. Oil is going lower too.
I can see $30 DRIP by mid-January, and $68 DRIP by March to June. But this could go back to IPO too, but that will take much longer, (5-10 years).
Could be wrong, invest at your own risk. I'm just some guy on the internet.
FB, and early market movements of $DRIP. I see long term weakness in S&P500, till mid 2019 at least. Oil is going lower too.I can see $30
DRIP by mid-January, and $68 DRIP by March to June. But this could go back to IPO too, but that will take much longer, (5-10 years).Could be wrong, invest at your own risk. I'm just some guy on the internet.
交易進行
註釋
Trade still active. Aproaching $16 resistance, possible minor correction here, next target ~$19.交易進行
We are approaching my TP of 19, broke through $16 with a little resistance as expected. I expect the graph to meet great resistance at 19-22 range.註釋
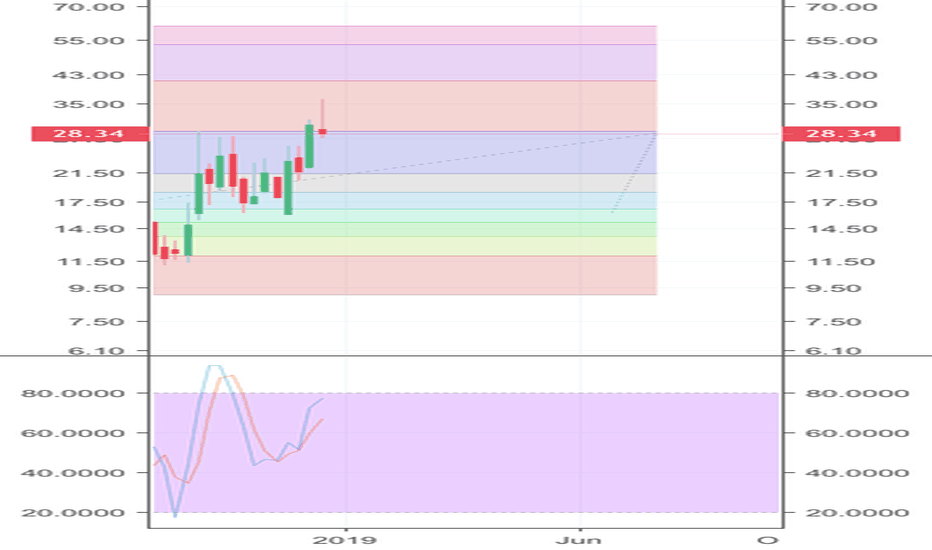
Consolidating for next rise to ~$33 Fibonacci level. We could hit this in the next two weeks, no later than February 1st.Please see my VIX chart for further details:

免責聲明
這些資訊和出版物並非旨在提供,也不構成TradingView提供或認可的任何形式的財務、投資、交易或其他類型的建議或推薦。請閱讀使用條款以了解更多資訊。