
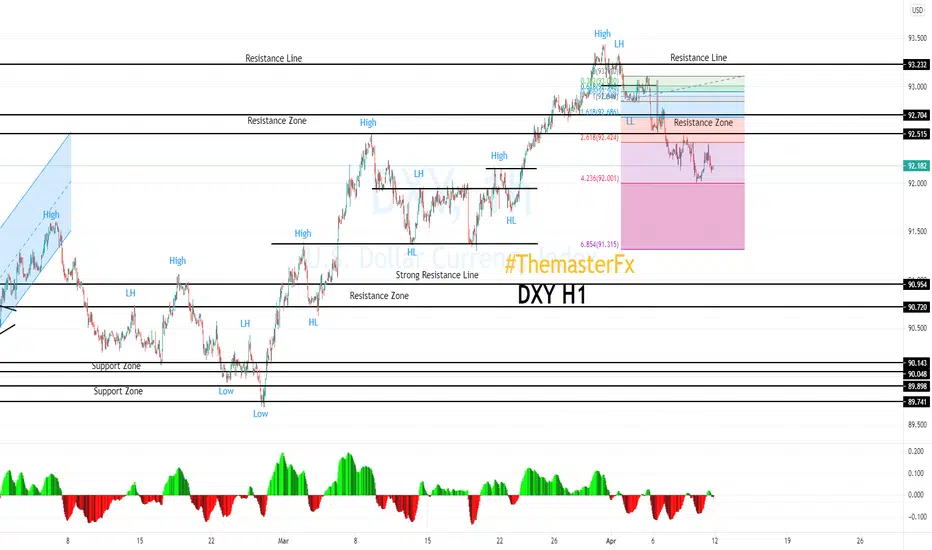
DXY on the 1H time-frame.
Steps:
1. The index created the lower high and breakout the previous low to confirmed the reversal pattern.
2. The index was running downtrend and already hit the Fibonacci level 423.6%
3. If the index breakout the previous low at 92.001 then the next level will be at the Fibonacci 685.4% at 91.315 or 91.378 at the support zone.
Steps:
1. The index created the lower high and breakout the previous low to confirmed the reversal pattern.
2. The index was running downtrend and already hit the Fibonacci level 423.6%
3. If the index breakout the previous low at 92.001 then the next level will be at the Fibonacci 685.4% at 91.315 or 91.378 at the support zone.

免責聲明
這些資訊和出版物並非旨在提供,也不構成TradingView提供或認可的任何形式的財務、投資、交易或其他類型的建議或推薦。請閱讀使用條款以了解更多資訊。
免責聲明
這些資訊和出版物並非旨在提供,也不構成TradingView提供或認可的任何形式的財務、投資、交易或其他類型的建議或推薦。請閱讀使用條款以了解更多資訊。