
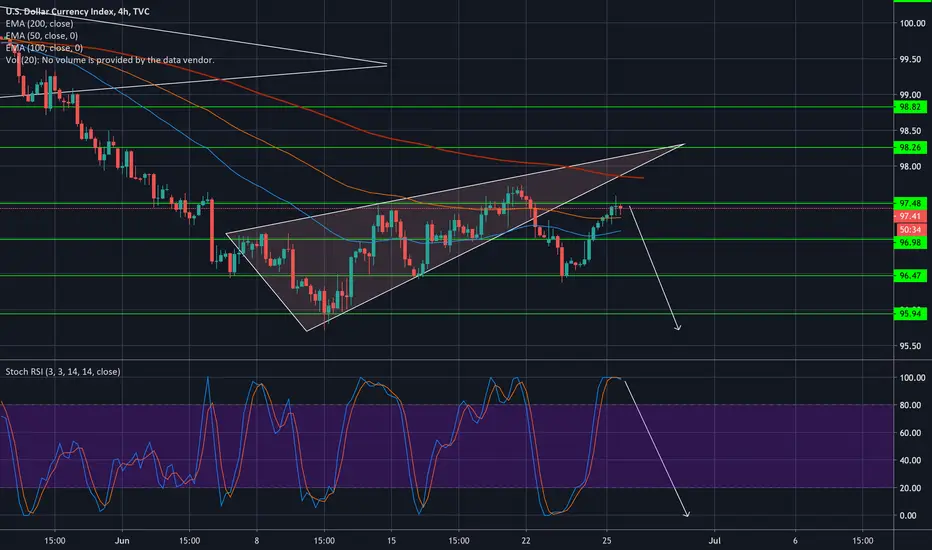
Looks like the inverse chart of 10yr & SP500, over bought on H4 D1 a larger correction to the DXY is underway and another pump to stocks crude oil seems more evident

If your interested in joining my group DM me for the link. We do Elliot Wave TA give trade signals and set ups. We have channels for all cryptocurrency and also many OTC stocks. TY
免責聲明
這些資訊和出版物並非旨在提供,也不構成TradingView提供或認可的任何形式的財務、投資、交易或其他類型的建議或推薦。請閱讀使用條款以了解更多資訊。
If your interested in joining my group DM me for the link. We do Elliot Wave TA give trade signals and set ups. We have channels for all cryptocurrency and also many OTC stocks. TY
免責聲明
這些資訊和出版物並非旨在提供,也不構成TradingView提供或認可的任何形式的財務、投資、交易或其他類型的建議或推薦。請閱讀使用條款以了解更多資訊。