
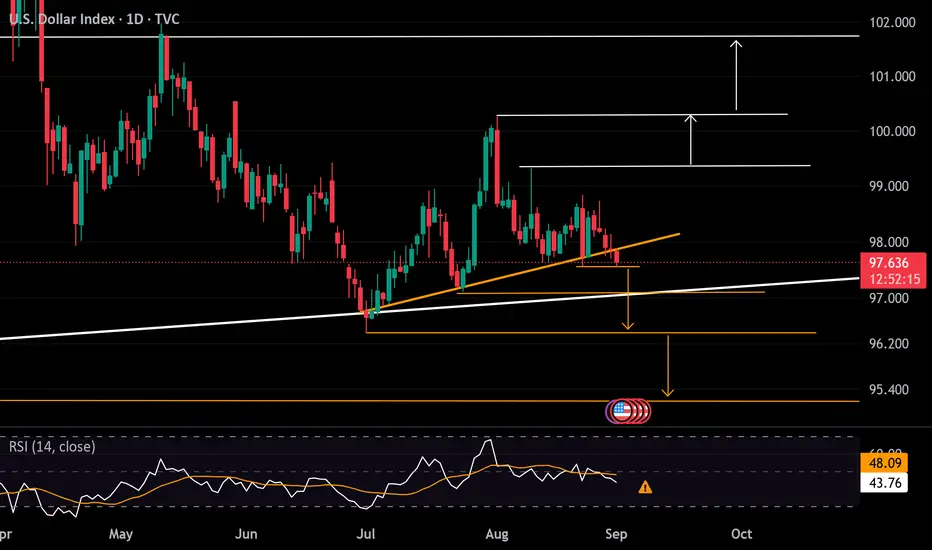
The DXY rebound between July and August has shaped a head and shoulders pattern. The chart is now testing the downside breakout, with the daily RSI turning bearish and slipping below the 50 level. A clean break below the 97.50 support could extend losses toward 97.20 and 96.50, with the full head and shoulders pattern pointing to a potential move down toward the 95.00–94.50 zone.
On the upside, a rebound above the 98.00 level would suggest some bullish recovery. However, a sustained move above 100.20 is needed to confidently shift the outlook toward a longer-term bullish reversal.
Key Events This Week
• ISM PMIs: to clarify US economic activity (Tuesday–Thursday)
• US NFPs and their impact on rate cut expectations and DXY price action (Friday)
• Effects of US trade and legal developments, EU political shifts, and Middle East escalations on risk sentiment
- Razan Hilal, CMT
On the upside, a rebound above the 98.00 level would suggest some bullish recovery. However, a sustained move above 100.20 is needed to confidently shift the outlook toward a longer-term bullish reversal.
Key Events This Week
• ISM PMIs: to clarify US economic activity (Tuesday–Thursday)
• US NFPs and their impact on rate cut expectations and DXY price action (Friday)
• Effects of US trade and legal developments, EU political shifts, and Middle East escalations on risk sentiment
- Razan Hilal, CMT

免責聲明
這些資訊和出版物並非旨在提供,也不構成TradingView提供或認可的任何形式的財務、投資、交易或其他類型的建議或推薦。請閱讀使用條款以了解更多資訊。