
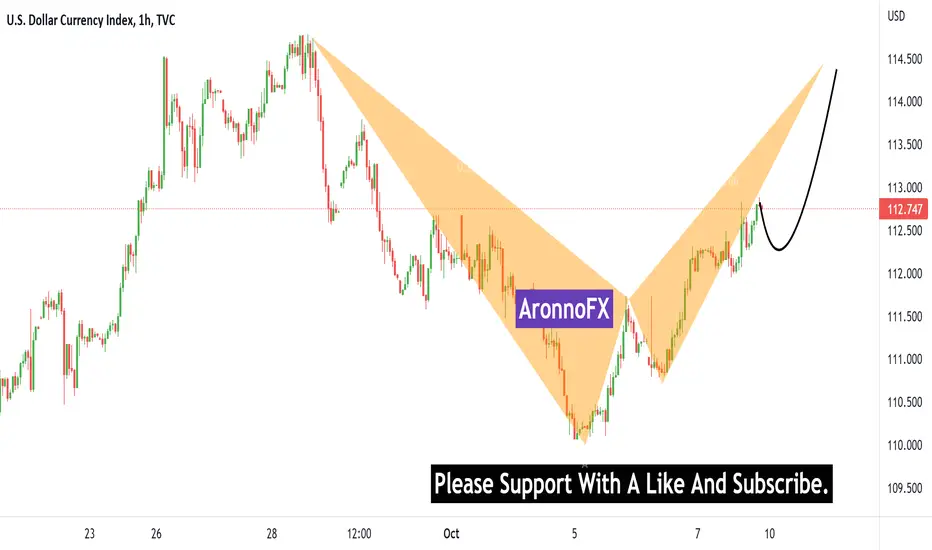
In this situation DXY chart Hopefully create bearish butterfly pattern.
So, market need to Seem sell correction on 112.180 support zone then fully
bullish or if breakout 113.037 resistance level, then market Buy to 114.163
and 115.710 resistance level.

免責聲明
這些資訊和出版物並非旨在提供,也不構成TradingView提供或認可的任何形式的財務、投資、交易或其他類型的建議或推薦。請閱讀使用條款以了解更多資訊。