
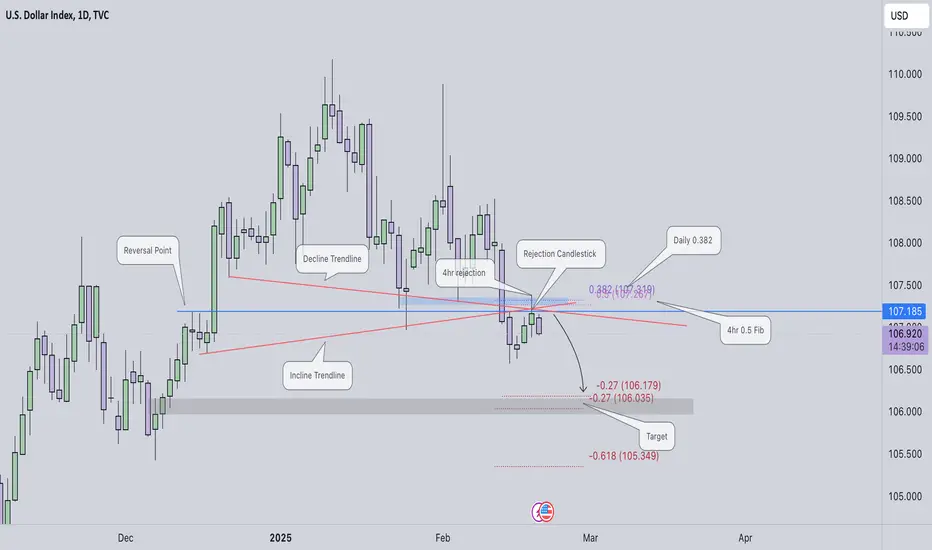
The US Dollar Index (DXY) is currently indicating the likely direction after closing below 106.965. I anticipate a move back to the 107.200-250 range before continuing its bearish swing. Several confluences support this, including the reversal point, an ascending trendline, a descending trendline, a rejection candlestick, the daily 0.382 Fibonacci level, the 4-hour 0.5 Fibonacci level, and a 4-hour order block. My target for the DXY is 106.083. As for gold, it has reached a new all-time high of 2954.944. I expect a pullback before it heads higher, potentially towards the 3000 level.
4hr DXY Chart

1hr DXY Chart

30m Gold Chart

4hr DXY Chart
1hr DXY Chart
30m Gold Chart

免責聲明
這些資訊和出版物並非旨在提供,也不構成TradingView提供或認可的任何形式的財務、投資、交易或其他類型的建議或推薦。請閱讀使用條款以了解更多資訊。
免責聲明
這些資訊和出版物並非旨在提供,也不構成TradingView提供或認可的任何形式的財務、投資、交易或其他類型的建議或推薦。請閱讀使用條款以了解更多資訊。