
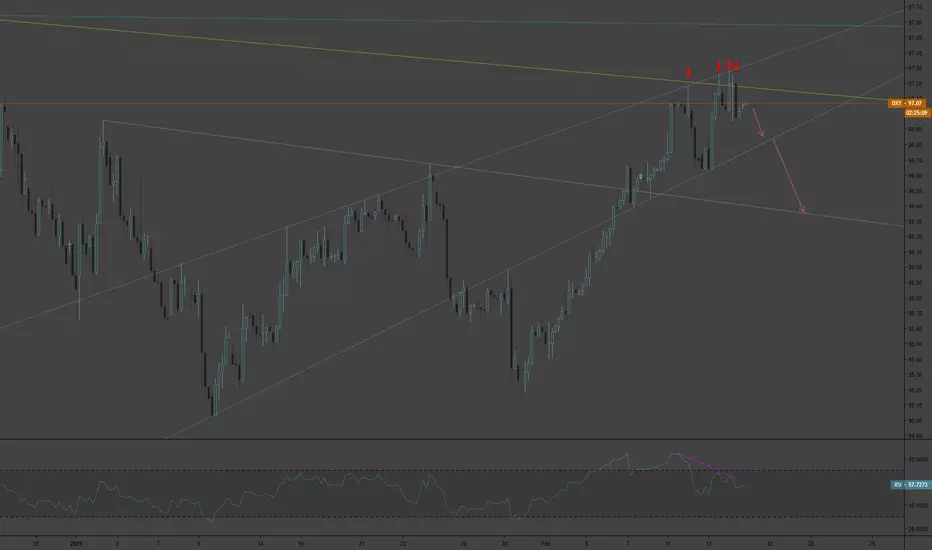
The yellow trendline is drawn from the January 2016 high.
DXY bulls have been rejected a total of four times over the past few sessions, as shown by the red arrows on the chart.
Bearish divergence on the 4 hour chart may indicate bulls are losing momentum, at least in the short term....
Additional trendlines are drawn from recent swing highs / lows and seem to provide strong suppoort / resistance. As long as the price remains below the yellow line, I will remain bearish on the USD.
Gold looks ready to take advantage of any USD weakness after bouncing off channel support to break through trendline resistance. Perhaps a change in risk sentiment.... USDJPY and SPY both look like they're ready to fall.
DXY bulls have been rejected a total of four times over the past few sessions, as shown by the red arrows on the chart.
Bearish divergence on the 4 hour chart may indicate bulls are losing momentum, at least in the short term....
Additional trendlines are drawn from recent swing highs / lows and seem to provide strong suppoort / resistance. As long as the price remains below the yellow line, I will remain bearish on the USD.
Gold looks ready to take advantage of any USD weakness after bouncing off channel support to break through trendline resistance. Perhaps a change in risk sentiment.... USDJPY and SPY both look like they're ready to fall.

免責聲明
這些資訊和出版物並非旨在提供,也不構成TradingView提供或認可的任何形式的財務、投資、交易或其他類型的建議或推薦。請閱讀使用條款以了解更多資訊。