
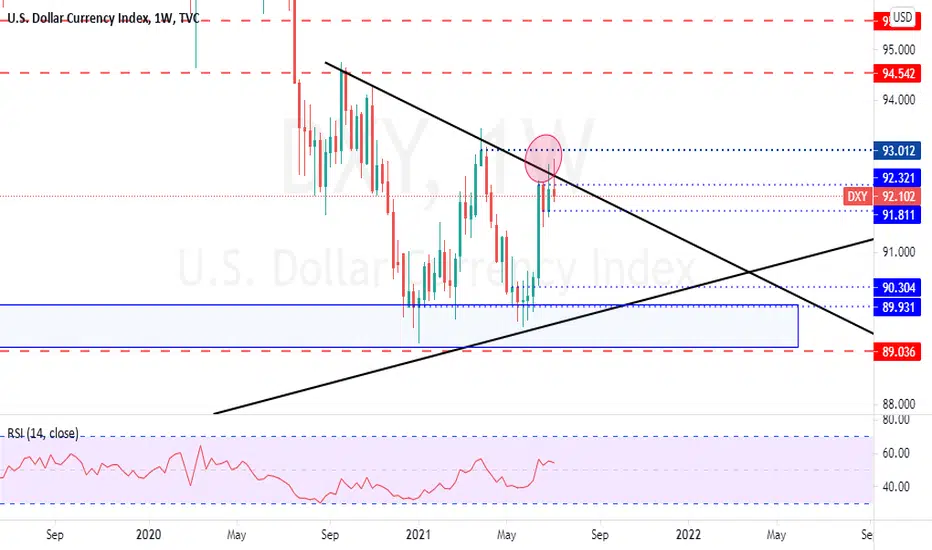
DXY still didnt manage to break the trendline acting as strong resistance, which may show some weakness for the bears to try and send the prices back down. But until they dont manage to break the support on 91.80, DXY still has an opportunity to gain some strength. And if the bulls manage to break the weekly resistance on 93.0 will bring more strength to take the prices higher.
- Clearly on the MONTHLY time frame we are still on a bearish trend, currently testing the 78.6% FIBONACCI RETRACEMENT.
- WEEKLY time frame also showing a bearish trend.
- DAILY time frame still bullish, but breaking the neckline of a double top formed right on the weekly resistance, which we can interpret as a bearish sign. But we still have to break the 91.70 on the daily to be fully bearish on the daily time frame.
- Clearly on the MONTHLY time frame we are still on a bearish trend, currently testing the 78.6% FIBONACCI RETRACEMENT.
- WEEKLY time frame also showing a bearish trend.
- DAILY time frame still bullish, but breaking the neckline of a double top formed right on the weekly resistance, which we can interpret as a bearish sign. But we still have to break the 91.70 on the daily to be fully bearish on the daily time frame.

免責聲明
這些資訊和出版物並非旨在提供,也不構成TradingView提供或認可的任何形式的財務、投資、交易或其他類型的建議或推薦。請閱讀使用條款以了解更多資訊。