
**DXY**
The U.S. Dollar Index (DXY) is the benchmark for the entire market.
If you understand the direction of DXY, you hold the key to many other charts.
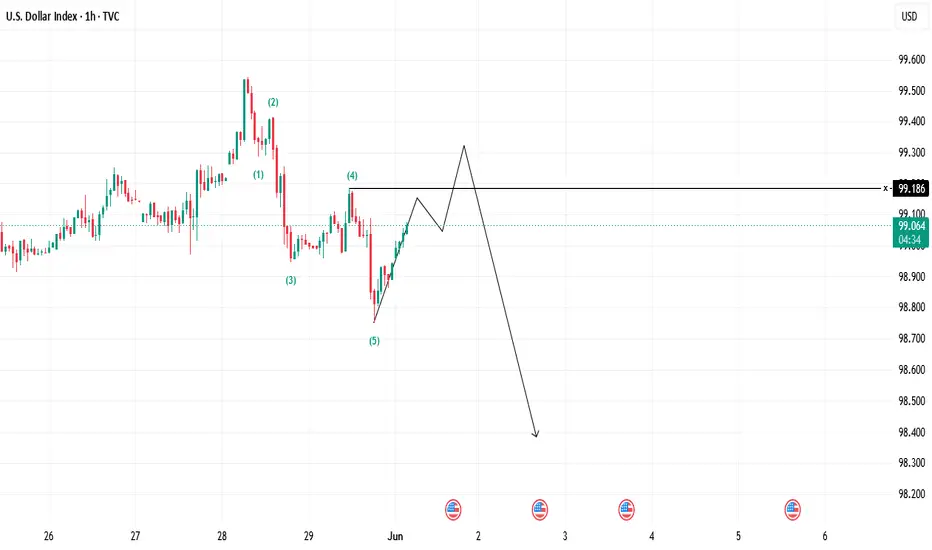
On the **1H timeframe**, a new wave appears to have started.
In my view, DXY may push higher during **Monday's session**, which would likely result in downward moves in **EUR/USD, GBP/USD, and Gold** — potentially creating an attractive trading opportunity.
The liquidity zone on the 1-hour chart has already been identified.
There is a strong possibility that this liquidity will be taken during Monday's session, after which an **impulsive bearish move** could begin.
The U.S. Dollar Index (DXY) is the benchmark for the entire market.
If you understand the direction of DXY, you hold the key to many other charts.
On the **1H timeframe**, a new wave appears to have started.
In my view, DXY may push higher during **Monday's session**, which would likely result in downward moves in **EUR/USD, GBP/USD, and Gold** — potentially creating an attractive trading opportunity.
The liquidity zone on the 1-hour chart has already been identified.
There is a strong possibility that this liquidity will be taken during Monday's session, after which an **impulsive bearish move** could begin.

免責聲明
這些資訊和出版物並非旨在提供,也不構成TradingView提供或認可的任何形式的財務、投資、交易或其他類型的建議或推薦。請閱讀使用條款以了解更多資訊。
免責聲明
這些資訊和出版物並非旨在提供,也不構成TradingView提供或認可的任何形式的財務、投資、交易或其他類型的建議或推薦。請閱讀使用條款以了解更多資訊。