
USD Index turned down in October 2022 where we think that the dollar might have seen an important, multi-year top. Notice that the decline is strong and impulsive, meaning that there can be more weakness coming this year. However, because of the lower swing high, around 104, there is also a chance that this is a big triangle on a daily chart, but also bearish structure. So in either case, we think that DXY can be headed to 100 this year, which can come in play after A-B-C rally is done.
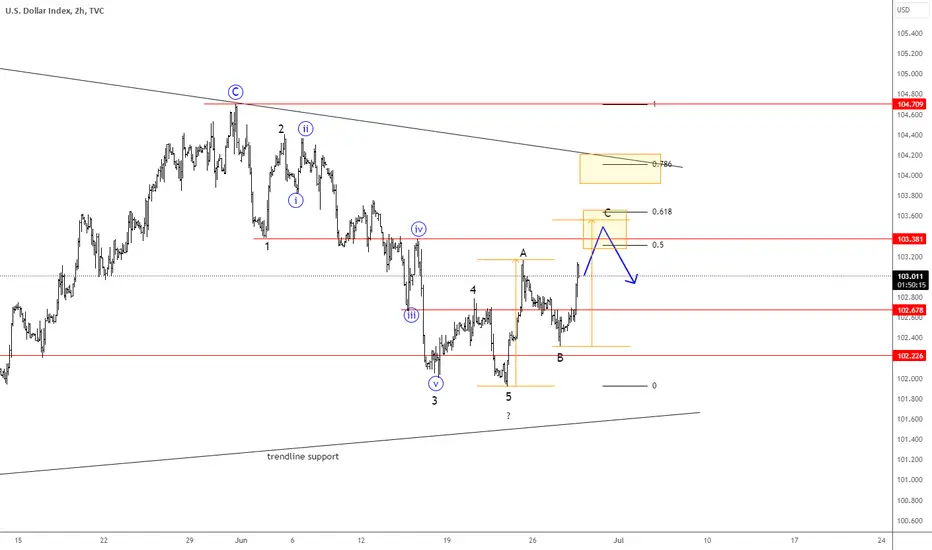
US Dollar - DXY is in new intraday recovery mode, which looks to be corrective as an A-B-C zig-zag pattern. Ideal resistance comes around 103.50 area, from where we should be aware of a bearish continuation.
US Dollar - DXY is in new intraday recovery mode, which looks to be corrective as an A-B-C zig-zag pattern. Ideal resistance comes around 103.50 area, from where we should be aware of a bearish continuation.
註釋
Inflation in US keeps cooling down and we can see stocks keep moving higher with room for more upside, as DXY is now trying to turn down from projectes resistance. If DXY slips back below 102.32 region, then we can easily expect a bearish continuation for the US Dollar.
Get the full Elliott Wave count at WaveTraders, €20 first month >> @ wavetraders.com/
Learn Elliott Waves Sale-65%
👉 wavetraders.com/academy/
Newsletter
👉 bit.ly/3FVPVzO
Learn Elliott Waves Sale-65%
👉 wavetraders.com/academy/
Newsletter
👉 bit.ly/3FVPVzO
相關出版品
免責聲明
這些資訊和出版物並非旨在提供,也不構成TradingView提供或認可的任何形式的財務、投資、交易或其他類型的建議或推薦。請閱讀使用條款以了解更多資訊。