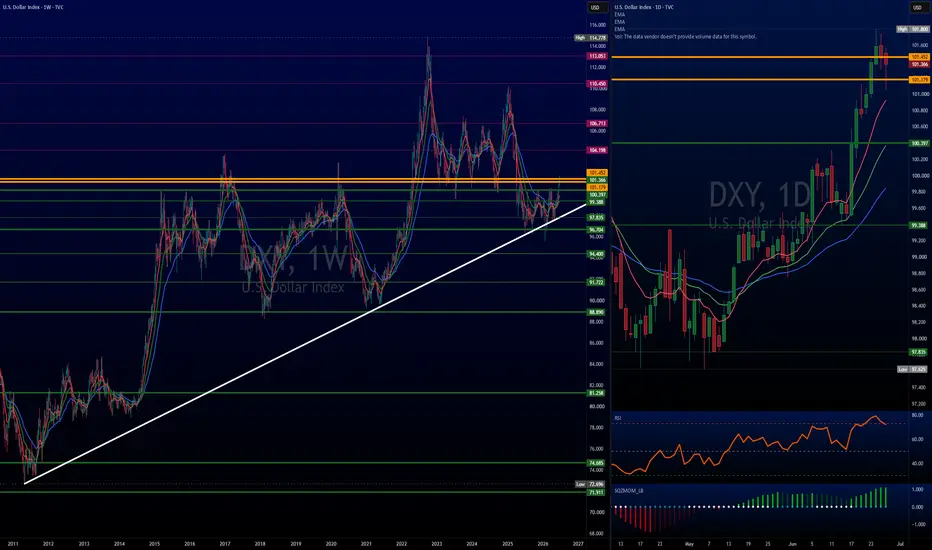
Looking at the Dollar Index  DXY across multiple timeframes reveals a beautifully structured macro setup.
The Weekly View:
Structurally very bullish. Price is trading firmly above all major moving averages, supported by a recent bullish moving average crossover. We are testing a major long term trendline and facing massive structural resistance here.
The Daily View:
We are seeing some expected short term weakness over the last 48 hours. Daily RSI aggressively broke into overbought territory, making this cooling off period completely logical. For now, the daily red moving average is holding as immediate support.
The 1-Hour View (not shown):
Shows short term downside momentum beginning to weaken right at local support.
The Playbook:
How long and how deep does this pullback go? If the daily red moving average gives way, a healthy technical pullback toward the major psychological 100 level, coinciding with the weekly moving averages and the long-term white ascending trendline is the logical target.
This pullback should give yields room to back off, sparking a strong relief rally across equities and crypto. But don't get complacent. IfDXY$ catches a bid at those weekly averages, it prints a massive macro higher low. When it turns back up alongside rates, a violent breakout past the resistance zone could trigger broad market capitulation offering the ultimate golden buying opportunity for risk assets.
Watch the weekly MAs for the structural pivot.
DXY across multiple timeframes reveals a beautifully structured macro setup.The Weekly View:
Structurally very bullish. Price is trading firmly above all major moving averages, supported by a recent bullish moving average crossover. We are testing a major long term trendline and facing massive structural resistance here.
The Daily View:
We are seeing some expected short term weakness over the last 48 hours. Daily RSI aggressively broke into overbought territory, making this cooling off period completely logical. For now, the daily red moving average is holding as immediate support.
The 1-Hour View (not shown):
Shows short term downside momentum beginning to weaken right at local support.
The Playbook:
How long and how deep does this pullback go? If the daily red moving average gives way, a healthy technical pullback toward the major psychological 100 level, coinciding with the weekly moving averages and the long-term white ascending trendline is the logical target.
This pullback should give yields room to back off, sparking a strong relief rally across equities and crypto. But don't get complacent. If
DXY$ catches a bid at those weekly averages, it prints a massive macro higher low. When it turns back up alongside rates, a violent breakout past the resistance zone could trigger broad market capitulation offering the ultimate golden buying opportunity for risk assets.Watch the weekly MAs for the structural pivot.

免責聲明
這些資訊和出版物並非旨在提供,也不構成TradingView提供或認可的任何形式的財務、投資、交易或其他類型的建議或推薦。請閱讀使用條款以了解更多資訊。
免責聲明
這些資訊和出版物並非旨在提供,也不構成TradingView提供或認可的任何形式的財務、投資、交易或其他類型的建議或推薦。請閱讀使用條款以了解更多資訊。