做多
EB - texbook chart
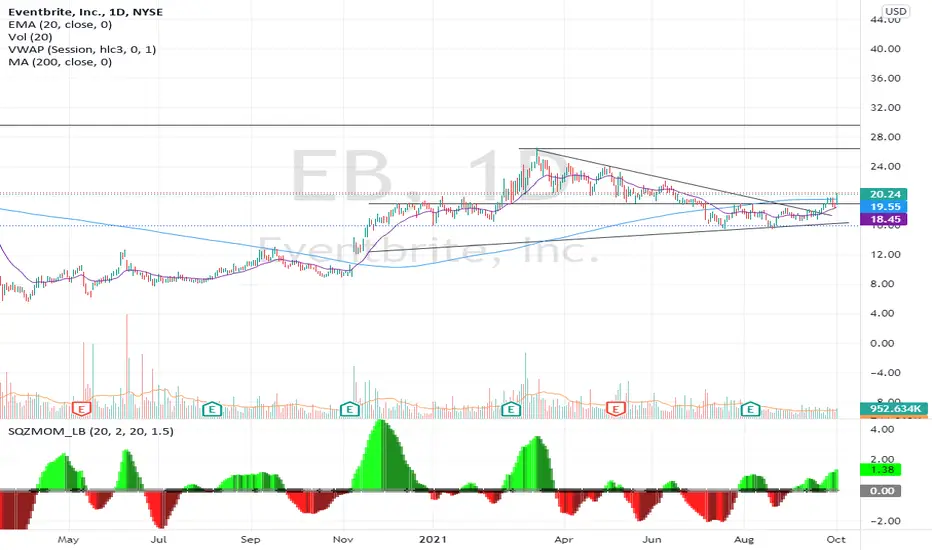
I went through a lot of charts this weekend. Most of them look choppy and ugly which is not surprising with this choppy market.
Picked this one which looks really healthy.
Just left the March-to-September downtrend, went above the strong level at 19.
Then made a healthy pull back, still hold arond the level. Yesterday - nice breakout.
MACD. RSI - positive
Weekly chart: breaking out from a wedge
Stop loss 18.40
Target 25
Picked this one which looks really healthy.
Just left the March-to-September downtrend, went above the strong level at 19.
Then made a healthy pull back, still hold arond the level. Yesterday - nice breakout.
MACD. RSI - positive
Weekly chart: breaking out from a wedge
Stop loss 18.40
Target 25

免責聲明
這些資訊和出版物並非旨在提供,也不構成TradingView提供或認可的任何形式的財務、投資、交易或其他類型的建議或推薦。請閱讀使用條款以了解更多資訊。
免責聲明
這些資訊和出版物並非旨在提供,也不構成TradingView提供或認可的任何形式的財務、投資、交易或其他類型的建議或推薦。請閱讀使用條款以了解更多資訊。