做多
EBSTBTC - Symmetrical Triangle.
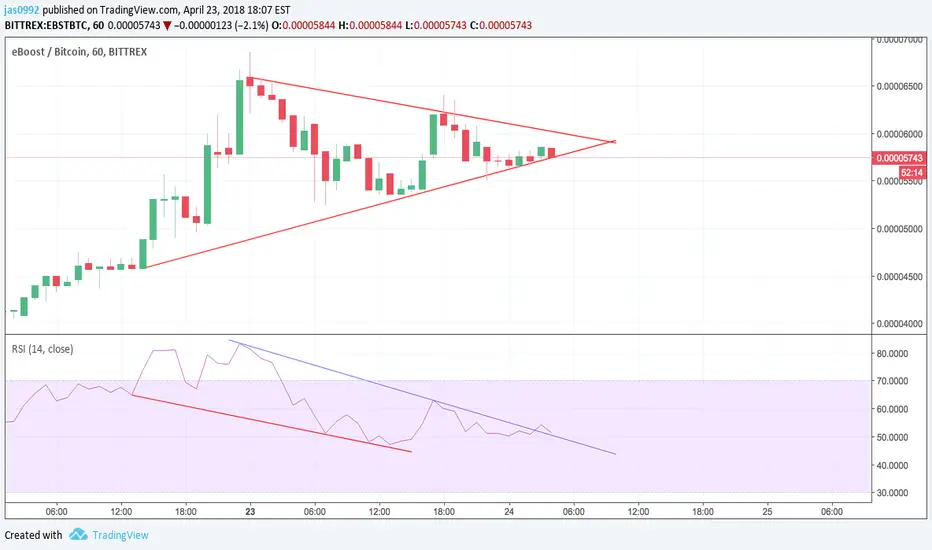
Symmetrical triangle being formed on 1H EBSTBTC triangle, which is a continuation pattern 75% of the time. There is also hidden divergence on the RSI oscillator (depicted with red trendline). Also, RSI seems to be breaking out of the downtrend line (depicted with blue trendline). EBST is looking bullish to me. However, we must wait for the price to break out of the pattern before entering a trade. Keeping a close eye on this, I would enter once the price breaks out of the triangle.
I am guessing the price would be around 0.00006100-0.00006200 when entry signal will be given. Based on that, my stop-loss would be 0.00005000 and target would be 0.00007500.
Constructive criticism is welcomed.
I am guessing the price would be around 0.00006100-0.00006200 when entry signal will be given. Based on that, my stop-loss would be 0.00005000 and target would be 0.00007500.
Constructive criticism is welcomed.
取消訂單
Symmetrical triangle broke to the wrong side. Trade not taken.
免責聲明
這些資訊和出版物並非旨在提供,也不構成TradingView提供或認可的任何形式的財務、投資、交易或其他類型的建議或推薦。請閱讀使用條款以了解更多資訊。
免責聲明
這些資訊和出版物並非旨在提供,也不構成TradingView提供或認可的任何形式的財務、投資、交易或其他類型的建議或推薦。請閱讀使用條款以了解更多資訊。