
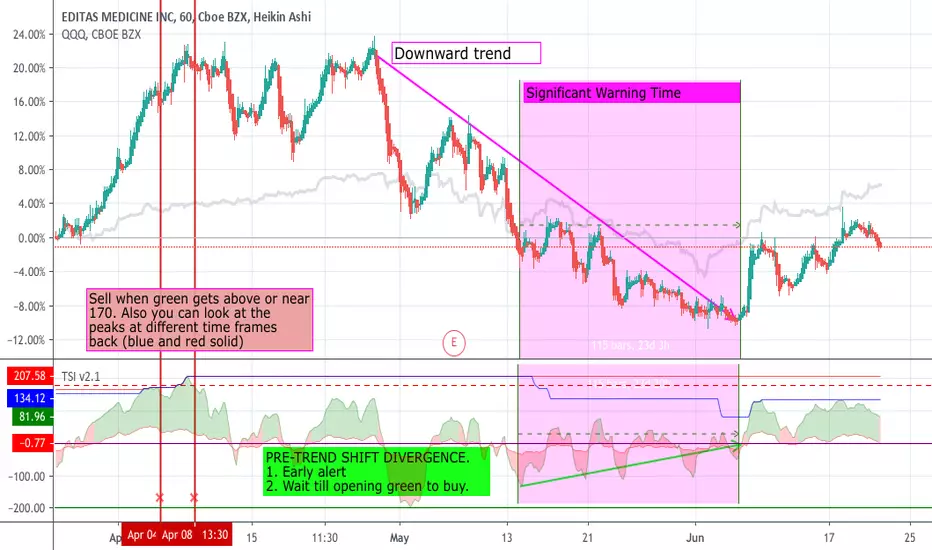
The attached chart has much of the explanation.
Here are the highlights:
I hope this is helpful. Feedback appreciated.
Here are the highlights:
- TSI gives early sell warning via high values (near 170), relative highs, or in rare cases an "x" signal.
- Divergence with price is also a key indicator of future action.
- Examine the divergence illustrated during the price drop and the (still red) TSI values.
I hope this is helpful. Feedback appreciated.

免責聲明
這些資訊和出版物並非旨在提供,也不構成TradingView提供或認可的任何形式的財務、投資、交易或其他類型的建議或推薦。請閱讀使用條款以了解更多資訊。