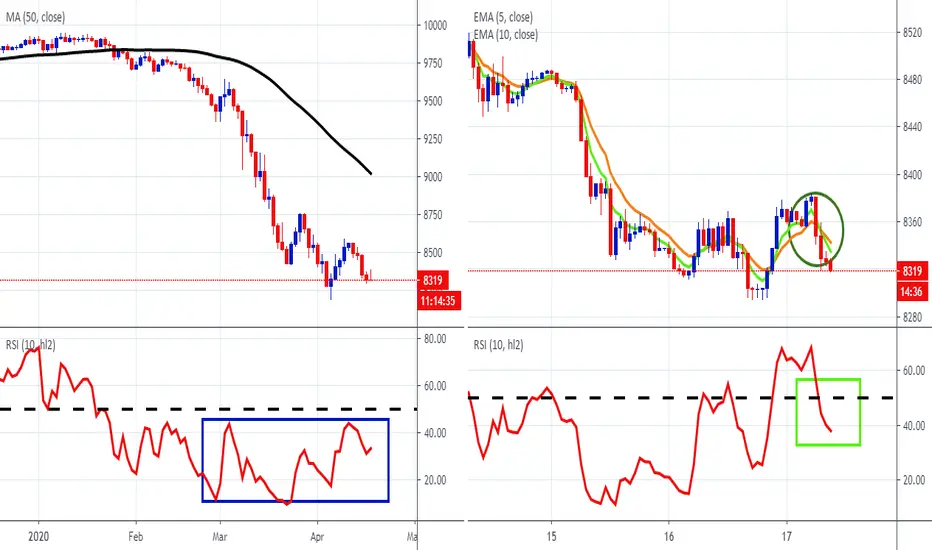
The left chart show's FXCM's emerging markets currency index, EMBASKET is black below its 50-day SMA. Moreover the SMA is pointing down with the RSI on the bearish side of 50 (blue rectangle). The right chart shows the hourly time frame. Here the green 5-hour EMA has crossed below the orange 10-hour EMA (green ellipse) and the RSI has moved below 50 (bright green rectangle). These are bearish developments and if the EMAs develop further angle and separation, the index will be showing further weak

Follow and Trade this analysis from your Charts. FXCM now Integrated with TradingView. Contact FXCM for more information.
免責聲明
這些資訊和出版物並非旨在提供,也不構成TradingView提供或認可的任何形式的財務、投資、交易或其他類型的建議或推薦。請閱讀使用條款以了解更多資訊。
免責聲明
這些資訊和出版物並非旨在提供,也不構成TradingView提供或認可的任何形式的財務、投資、交易或其他類型的建議或推薦。請閱讀使用條款以了解更多資訊。