
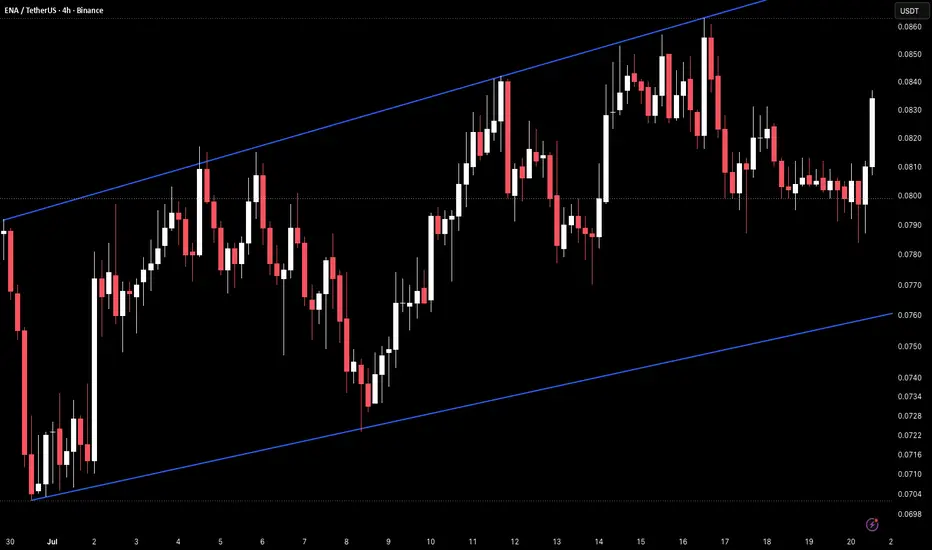
ENA on the 4H timeframe is currently trading around 0.0833 after reaching the upper boundary of a rising parallel channel near 0.0858–0.0860 on July 14 and pulling back, with price now holding above the 0.0830–0.0835 horizontal pivot as the rising lower trendline climbs into the 0.0756–0.0760 area beneath.
The chart shows a rising parallel channel originating from the late June low near 0.0704, with the lower trendline connecting the June 29 bottom through the July 9 low near 0.0726 and continuing to climb steeply through the structure, while the upper trendline capped the July 10 high near 0.0838 and the July 14 high near 0.0858–0.0860. Price has made two clean oscillations inside the channel, bouncing from the lower boundary each time before pushing into the upper trendline. Two horizontal reference levels define the internal pivots — one near 0.0830–0.0835 which has acted as a recurring ceiling through the mid-to-upper portion of the channel, and a second near 0.0798–0.0802 just below the midline. The most recent pullback from the July 14 upper boundary high has held above 0.0800–0.0802 so far, and price is currently pressing back toward 0.0830–0.0835 from below following a bounce off that level.
The 0.0830–0.0835 horizontal has been tested multiple times from both sides and is now the immediate level determining whether price pushes back toward the upper channel boundary or pulls back toward the lower trendline.
Key Levels To Watch
→ 0.0858–0.0860 – Upper channel boundary, resistance (dynamic)
→ 0.0838–0.0842 – Prior resistance, minor ceiling below upper boundary
→ 0.0830–0.0835 – Horizontal pivot, current test
→ 0.0798–0.0802 – Horizontal support, mid-channel reference
→ 0.0756–0.0760 – Rising lower trendline, dynamic support (climbing)
→ 0.0726–0.0730 – Prior trendline touch, secondary support
→ Below 0.0704 – Channel breakdown, bullish structure invalidated
A hold above 0.0830–0.0835 and a push back toward the upper channel boundary near 0.0858–0.0860 would continue the established oscillation pattern and keep the bullish channel structure fully intact, with a clean upper boundary break opening further upside above 0.0860.
A loss of 0.0798–0.0802 on a confirmed 4H close would pull price toward the rising lower trendline near 0.0756–0.0760, and a confirmed break below that level would invalidate the channel structure entirely and open downside toward 0.0726–0.0730 and below.
Channel structure intact after upper boundary rejection, price holding above horizontal pivot. Hold 0.0830–0.0835 → upper boundary near 0.0858–0.0860 back in play. Lose 0.0798–0.0802 → lower trendline near 0.0756–0.0760 next, break below invalidates channel. Bias bullish inside rising channel. Shift only on confirmed close below rising lower trendline.
The chart shows a rising parallel channel originating from the late June low near 0.0704, with the lower trendline connecting the June 29 bottom through the July 9 low near 0.0726 and continuing to climb steeply through the structure, while the upper trendline capped the July 10 high near 0.0838 and the July 14 high near 0.0858–0.0860. Price has made two clean oscillations inside the channel, bouncing from the lower boundary each time before pushing into the upper trendline. Two horizontal reference levels define the internal pivots — one near 0.0830–0.0835 which has acted as a recurring ceiling through the mid-to-upper portion of the channel, and a second near 0.0798–0.0802 just below the midline. The most recent pullback from the July 14 upper boundary high has held above 0.0800–0.0802 so far, and price is currently pressing back toward 0.0830–0.0835 from below following a bounce off that level.
The 0.0830–0.0835 horizontal has been tested multiple times from both sides and is now the immediate level determining whether price pushes back toward the upper channel boundary or pulls back toward the lower trendline.
Key Levels To Watch
→ 0.0858–0.0860 – Upper channel boundary, resistance (dynamic)
→ 0.0838–0.0842 – Prior resistance, minor ceiling below upper boundary
→ 0.0830–0.0835 – Horizontal pivot, current test
→ 0.0798–0.0802 – Horizontal support, mid-channel reference
→ 0.0756–0.0760 – Rising lower trendline, dynamic support (climbing)
→ 0.0726–0.0730 – Prior trendline touch, secondary support
→ Below 0.0704 – Channel breakdown, bullish structure invalidated
A hold above 0.0830–0.0835 and a push back toward the upper channel boundary near 0.0858–0.0860 would continue the established oscillation pattern and keep the bullish channel structure fully intact, with a clean upper boundary break opening further upside above 0.0860.
A loss of 0.0798–0.0802 on a confirmed 4H close would pull price toward the rising lower trendline near 0.0756–0.0760, and a confirmed break below that level would invalidate the channel structure entirely and open downside toward 0.0726–0.0730 and below.
Channel structure intact after upper boundary rejection, price holding above horizontal pivot. Hold 0.0830–0.0835 → upper boundary near 0.0858–0.0860 back in play. Lose 0.0798–0.0802 → lower trendline near 0.0756–0.0760 next, break below invalidates channel. Bias bullish inside rising channel. Shift only on confirmed close below rising lower trendline.

免責聲明
這些資訊和出版物並非旨在提供,也不構成TradingView提供或認可的任何形式的財務、投資、交易或其他類型的建議或推薦。請閱讀使用條款以了解更多資訊。