Lucrative Short on $EOS Incoming
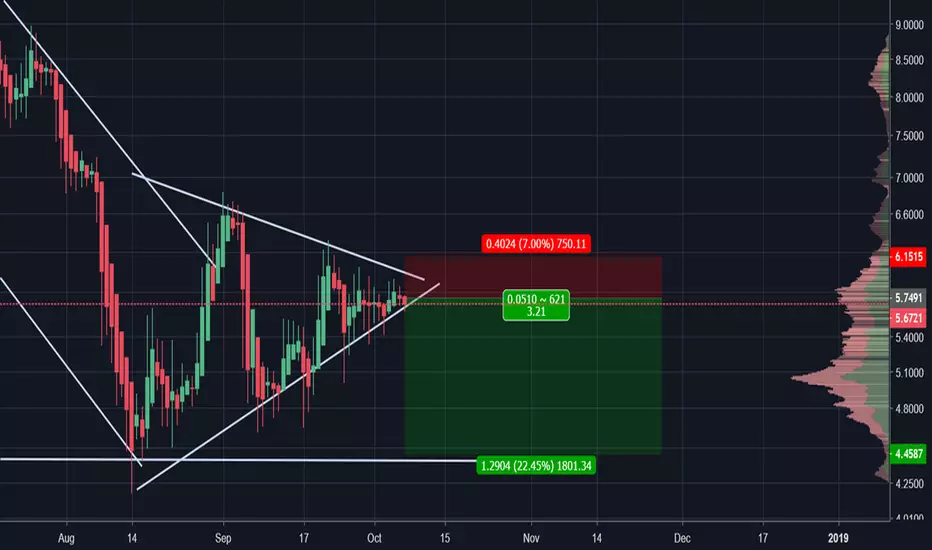
 EOS is a coin that we have not frequently covered, so we’re going to go ahead and do so in as comprehensive a manner as possible in this price analysis article here.EOS Price Analysis
Rather than wasting time, let’s just get right to it.
In the picture that you see above, we see a potential for the confirmation of this downtrend line.
In the above chart, we can see the ‘beginning’ of the downtrend where the highest box is located, with the second box providing what could potentially be a second point of resistance that was tested to establish the downtrend line.
However, it is this next bit of price action for
EOS that will help determine whether or not this downtrend is confirmed or proven to be effectively valueless.We say this because, typically, a trendline must be tested three times before it is deemed to be a legitimate point of resistance/support.
It is also worth noting that we are on the daily resolution, so the supports and resistances that we map out at this point are going to be substantially more impactful than they otherwise would be.
What Do We Do From Here?
The next step in our mission is to figure out the likelihood of
EOS breaking over our supposed downtrend resistance on the daily chart.Apparent Bear Flag Formation on the Daily Chart
So that dictates that the future price action should decline precipitously:
So, since we’ve established that we have a firm belief that the price is going down, let’s see if we can confirm that with the presence of some additional indicators
Relative Strength Index (14)
The RSI(14) actually defies our expectations that the price should be headed downward.
The line that is drawn above shows that there is a solid 'uptrend' in the RSI. This means that the price has been slowly gaining momentum over time (consistent higher lows).
MACD (Moving Average Convergence Divergence)
However, the MACD tells another story. As we can see on the chart above, the bars on the histogram are steadily declining, which is almost always a key of (at the very least) consolidation, which normally precipitates a reversal in the price action/trend (which has been upward in recent days/weeks for
EOS).Zero_n0ncense Reversion Ribbon
What one can witness above is the most sophisticated iteration of the MACD indicator ever created.
Specially tuned to track the ‘heat zones’ of buying/selling pressure via candlestick color changes and fills in between the signal and MACD lines (green to red of varying degrees of greenness and redness), this indicator is programmed to let us know with specific accuracy what is going on.
And, from what can be observed at this point, the indicator has signaled that the price will continue to decrease from the point that it is at currently.
So, we’ve racked up another confirmation of bearish activity for
EOS on the daily resolution.Zero_n0ncense RSI Balance of Power
This is yet another custom indicator that is purposed to grant individuals the ability to discern the momentum of buying vs. selling.
In the chart above, we can confirm heavy selling pressure at this moment in time.
Support Points
$4.40 is the longest shot short on
EOS right now and the most solid support for EOS that we can identify at this point.When you scroll out on the chart, its easy to see why:
Conclusion
Here’s the R/R on the trade:

免責聲明
這些資訊和出版物並非旨在提供,也不構成TradingView提供或認可的任何形式的財務、投資、交易或其他類型的建議或推薦。請閱讀使用條款以了解更多資訊。