做多
EOS USDT BUY
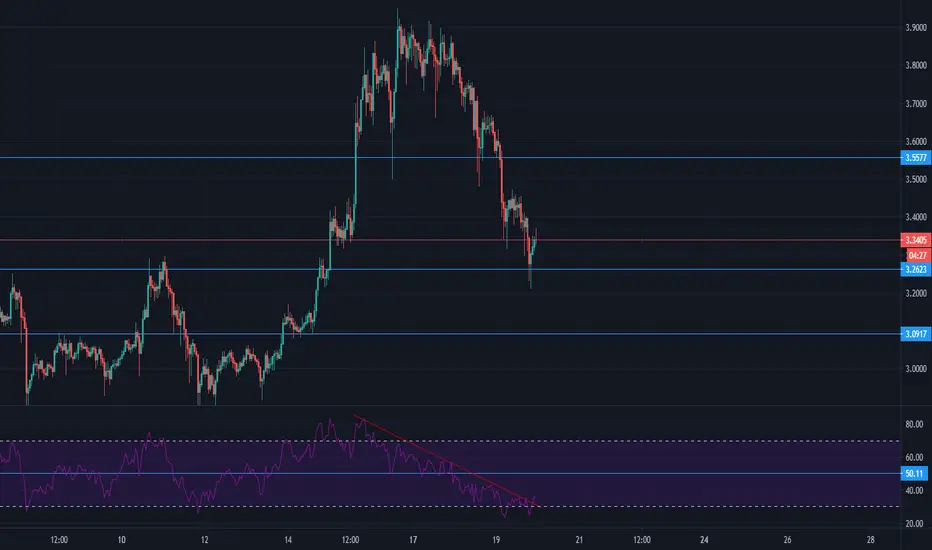
Horizontal line at 3.2623 is my area of value which is also acting as my SR line. Price was tested the support line and is now bullish. The red and green candle that tested my support line formed a morning star on the 30 Minutes time frame indicating that there will be a bullish movement. There were series of lower highs on my RSI (14) until the market was oversold (below 30 level). It has broken the resistance of the trend line drawn on the RSI and also broke pass the oversold level.
I choose to go long taking my profit at horizontal line 3.5577. If price comes back to hit horizontal line 3.1669, the trade will be invalid (Stop Loss).
I choose to go long taking my profit at horizontal line 3.5577. If price comes back to hit horizontal line 3.1669, the trade will be invalid (Stop Loss).

免責聲明
這些資訊和出版物並非旨在提供,也不構成TradingView提供或認可的任何形式的財務、投資、交易或其他類型的建議或推薦。請閱讀使用條款以了解更多資訊。