做空
EOS Weekly Re-Distribution
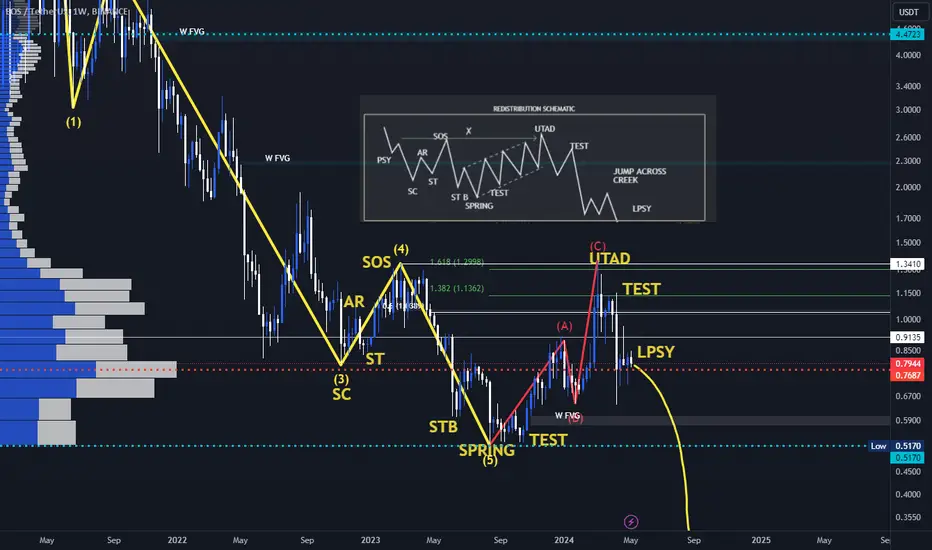
This is the EOS weekly chart, side by side with a re-distribution schematic. If you zoom out you'll also notice that I highlighted the 5 wave impulsive structure to the downside that we had during the bear market, and how this ABC correction took out the wave 4 highs, exactly how it's supposed to before a continuation would begin. The monthly indicators all look extremely bearish as well, on most of the altcoins actually.
I would recommend pulling your capital and saving it to buy lower prices, as I do believe that's where we are headed.
I would recommend pulling your capital and saving it to buy lower prices, as I do believe that's where we are headed.

Premium Signals Group: patreon.com/DigiLex
相關出版品
免責聲明
這些資訊和出版物並非旨在提供,也不構成TradingView提供或認可的任何形式的財務、投資、交易或其他類型的建議或推薦。請閱讀使用條款以了解更多資訊。
Premium Signals Group: patreon.com/DigiLex
相關出版品
免責聲明
這些資訊和出版物並非旨在提供,也不構成TradingView提供或認可的任何形式的財務、投資、交易或其他類型的建議或推薦。請閱讀使用條款以了解更多資訊。