
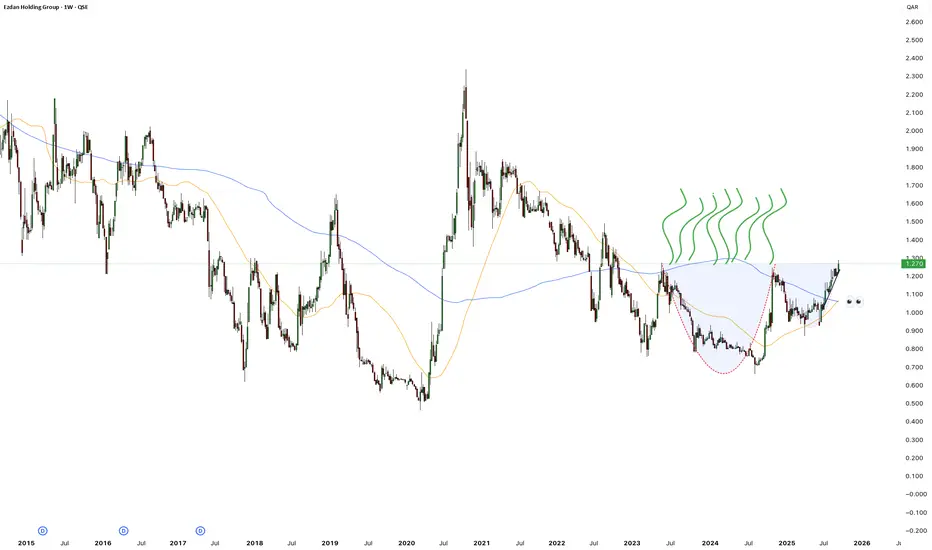
🔹 Chart Structure
The chart shows a long downtrend since 2017, followed by a prolonged base around 0.80–1.00 QAR.
Recently, the stock formed a rounded bottom (cup-like pattern), suggesting accumulation and a potential trend reversal.
Price is now testing the 1.25–1.30 QAR zone, which aligns with the 200-week moving average (blue line) — a key resistance area.
🔹 Moving Averages
50-week MA (orange) has started to turn upward, showing early bullish momentum.
200-week MA (blue) remains above price but is being challenged.
A confirmed golden cross (50-week MA crossing above the 200-week MA) would strengthen the bullish outlook.
🔹 Key Levels
Support: 1.10–1.15 QAR (previous breakout and near the 50-week MA).
Immediate Resistance: 1.30–1.35 QAR (current barrier).
Next Target Zone: 1.50–1.60 QAR (cluster of past highs, marked with green arrows).
Long-term Resistance: 1.80 QAR and above.
The chart shows a long downtrend since 2017, followed by a prolonged base around 0.80–1.00 QAR.
Recently, the stock formed a rounded bottom (cup-like pattern), suggesting accumulation and a potential trend reversal.
Price is now testing the 1.25–1.30 QAR zone, which aligns with the 200-week moving average (blue line) — a key resistance area.
🔹 Moving Averages
50-week MA (orange) has started to turn upward, showing early bullish momentum.
200-week MA (blue) remains above price but is being challenged.
A confirmed golden cross (50-week MA crossing above the 200-week MA) would strengthen the bullish outlook.
🔹 Key Levels
Support: 1.10–1.15 QAR (previous breakout and near the 50-week MA).
Immediate Resistance: 1.30–1.35 QAR (current barrier).
Next Target Zone: 1.50–1.60 QAR (cluster of past highs, marked with green arrows).
Long-term Resistance: 1.80 QAR and above.

免責聲明
這些資訊和出版物並非旨在提供,也不構成TradingView提供或認可的任何形式的財務、投資、交易或其他類型的建議或推薦。請閱讀使用條款以了解更多資訊。