
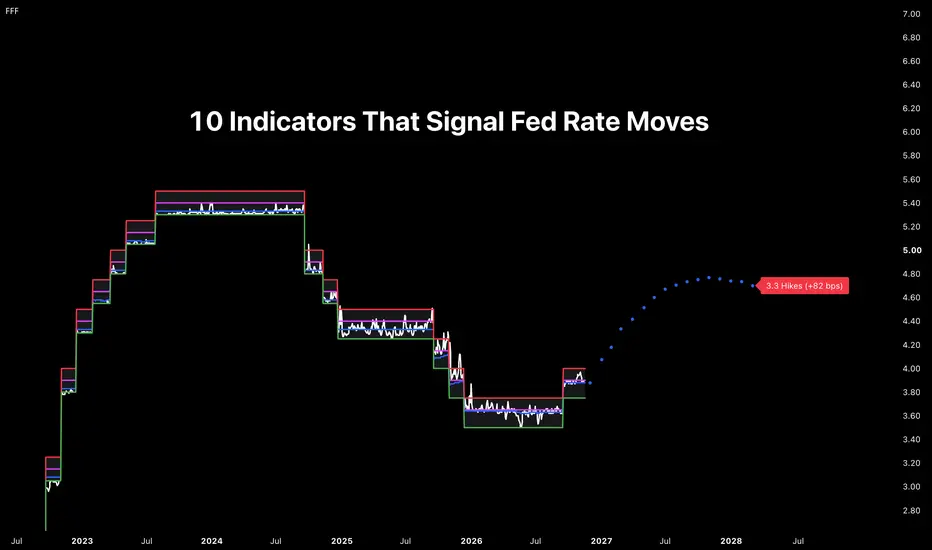
In this publication, we examine the Federal Reserve’s 2022 rate-hiking and 2024 rate-cutting cycles through the lens of 10 indicators. The first nine indicators are compared against their historical interquartile ranges during periods when the Trimmed Mean PCE Inflation Rate ( PCETRIM12M159SFRBDAL) was between 2% and 2.5%. Readings that deviate sufficiently from the historical median to fall outside this historical range signal tightening or easing, while readings within the range signal holding rates unchanged. The tenth indicator, the Federal Funds Forecast (FFF), shows the market-implied path of future interest rates based on the Federal Funds Futures market (ZQ1!).
Indicator 1: Fed Treasury Holdings YoY
Fed Treasury Holdings YoY measures the annual growth in US Treasury Securities Held Outright (TREAST) by the Federal Reserve. Increasing holdings generally reduce the supply of Treasuries available to the private sector, driving up bond prices and lowering borrowing costs, while decreasing holdings generally increase the supply of Treasuries available to the private sector, driving down bond prices and raising borrowing costs. In March 2022, holdings were growing at +18.5% YoY, substantially above the +4.6% historical median, which signaled tightening. In August 2024, holdings were contracting at −12.1% YoY, which signaled easing.

Indicator 2: 2Y Treasury − Fed Funds Rate
2Y Treasury − Fed Funds Rate measures the spread between the 2-Year Treasury Constant Maturity Yield (DGS2) and the Effective Federal Funds Rate (DFF). A positive spread generally suggests that markets expect higher short-term interest rates, while a negative spread generally suggests that markets expect lower short-term interest rates. In March 2022, the spread was +123 bps, substantially above the +44 bps historical median, which signaled tightening. In August 2024, the spread was −142 bps, which signaled easing.

Indicator 3: Fed Funds Rate − Taylor Rule
Fed Funds Rate − Taylor Rule measures the difference between the Effective Federal Funds Rate (DFF) and the policy rate prescribed by the Taylor Rule. The Taylor Rate is calculated using the GDP Price Deflator (GDPDEF), Real GDP (GDPC1), and Potential Real GDP (GDPPOT), according to the following formula:
Taylor Rate = 2% Equilibrium Real Rate + GDP Price Deflator YoY + 0.5 × (GDP Price Deflator YoY − 2% Inflation Target) + 0.5 × ((Real GDP − Potential Real GDP) / Potential Real GDP) × 100
A negative gap indicates that the federal funds rate is more accommodative than the rule prescribes, while a positive gap indicates that the federal funds rate is less accommodative than the rule prescribes. In March 2022, the gap was −1204 bps, substantially below the −70 bps historical median, which signaled tightening. In August 2024, the gap was +1 bp, which signaled holding rates unchanged.

Indicator 4: Bank Loans and Leases YoY
Bank Loans and Leases YoY measures the annual growth in Commercial Bank Loans and Leases (LOANS). Faster credit growth generally indicates stronger economic activity in the private sector, while slower credit growth generally indicates weaker economic activity in the private sector. In March 2022, lending was growing at +5.7% YoY, below the +7.6% historical median, which signaled holding rates unchanged. In August 2024, lending was growing at +2.4% YoY, which signaled easing.

Indicator 5: Broad M2 Money Supply YoY
Broad M2 Money Supply YoY measures the annual growth in the US M2 Money Supply (M2SL). Faster M2 growth generally indicates stronger inflationary pressure, while slower M2 growth generally indicates weaker inflationary pressure. In March 2022, M2 was growing at +10.6% YoY, substantially above the +5.0% historical median, which signaled tightening. In August 2024, M2 was growing at +2.0% YoY, which signaled easing.

Indicator 6: U3 Unemployment − NAIRU
U3 Unemployment − NAIRU measures the difference between the seasonally adjusted U-3 Civilian Unemployment Rate (UNRATE) and the Non-Accelerating Inflation Rate of Unemployment (NAIRU), proxied by the CBO Noncyclical Rate of Unemployment (NROU). A negative gap generally indicates that the labor market is tight enough to put upward pressure on inflation, while a positive gap generally indicates that the labor market is loose enough to put downward pressure on inflation. In March 2022, the gap was −54 bps, substantially below the +23 bps historical median, which signaled tightening. In August 2024, the gap was −22 bps, which signaled holding rates unchanged.

Indicator 7: Hourly Wage − Productivity YoY
Hourly Wage − Productivity YoY measures the difference between the annual growth in Average Hourly Earnings (AHETPI) and the annual growth in Labor Productivity (OPHNFB). A higher gap generally indicates stronger wage-driven inflationary pressure, while a lower gap generally indicates weaker wage-driven inflationary pressure. In March 2022, the gap was +791 bps, substantially above the +144 bps historical median, which signaled tightening. In August 2024, the gap was +128 bps, which signaled holding rates unchanged.

Indicator 8: Brent Crude Spot Price YoY
Brent Crude Spot Price YoY measures the annual change in Brent Crude Oil Spot Prices ( DCOILBRENTEU). Rising oil prices generally increase inflationary pressure, while falling oil prices generally reduce inflationary pressure. In March 2022, prices were increasing at +71.8% YoY, substantially above the +10.5% historical median, which signaled tightening. In August 2024, prices were declining at −13.5% YoY, which signaled easing.

Indicator 9: 10Y Breakeven Inflation Rate
10Y Breakeven Inflation Rate measures the difference between the 10-Year Treasury Constant Maturity Yield (DGS10) and the 10-Year Treasury Inflation-Indexed Yield (DFII10). A wider spread generally suggests higher long-term inflation expectations, while a narrower spread generally suggests lower long-term inflation expectations. In March 2022, the breakeven rate was 2.6%, above the 2.3% historical median, which signaled tightening. In August 2024, the breakeven rate was 2.2%, which signaled holding rates unchanged.

Indicator 10: Federal Funds Futures
30-Day Federal Funds Futures (ZQ1!) are monthly contracts priced at 100 minus the market-implied average Effective Federal Funds Rate (DFF) for each contract month. The open-source Federal Funds Forecast indicator translates these futures prices into a forward-looking path for the federal funds rate, showing the approximate number of rate hikes or cuts expected by the market. In March 2022, futures implied +181 bps of tightening over the following 15 months, equivalent to approximately 7.2 rate hikes. In August 2024, futures implied −217 bps of easing over the following 15 months, equivalent to approximately 8.7 rate cuts.

In summary, nine of the ten indicators signaled that policy should be tightened in March 2022, while one signaled holding rates unchanged. Federal funds futures priced in approximately 7.2 rate hikes, ahead of the subsequent +525 bps hiking cycle. By August 2024, six of the ten indicators signaled that policy should be eased, while four signaled holding rates unchanged. Futures priced in approximately 8.7 rate cuts, ahead of the subsequent −175 bps cutting cycle. Together, these ten indicators provide investors with a systematic framework for anticipating the Federal Reserve’s policy rate. While these indicators have historically provided valuable insights, investors should remain mindful that historical relationships and market-implied expectations evolve as economic conditions, inflation dynamics, and Federal Reserve policy responses change over time.
PCETRIM12M159SFRBDAL) was between 2% and 2.5%. Readings that deviate sufficiently from the historical median to fall outside this historical range signal tightening or easing, while readings within the range signal holding rates unchanged. The tenth indicator, the Federal Funds Forecast (FFF), shows the market-implied path of future interest rates based on the Federal Funds Futures market (ZQ1!).Indicator 1: Fed Treasury Holdings YoY
Fed Treasury Holdings YoY measures the annual growth in US Treasury Securities Held Outright (
TREAST) by the Federal Reserve. Increasing holdings generally reduce the supply of Treasuries available to the private sector, driving up bond prices and lowering borrowing costs, while decreasing holdings generally increase the supply of Treasuries available to the private sector, driving down bond prices and raising borrowing costs. In March 2022, holdings were growing at +18.5% YoY, substantially above the +4.6% historical median, which signaled tightening. In August 2024, holdings were contracting at −12.1% YoY, which signaled easing.Indicator 2: 2Y Treasury − Fed Funds Rate
2Y Treasury − Fed Funds Rate measures the spread between the 2-Year Treasury Constant Maturity Yield (
DGS2) and the Effective Federal Funds Rate (DFF). A positive spread generally suggests that markets expect higher short-term interest rates, while a negative spread generally suggests that markets expect lower short-term interest rates. In March 2022, the spread was +123 bps, substantially above the +44 bps historical median, which signaled tightening. In August 2024, the spread was −142 bps, which signaled easing.Indicator 3: Fed Funds Rate − Taylor Rule
Fed Funds Rate − Taylor Rule measures the difference between the Effective Federal Funds Rate (
DFF) and the policy rate prescribed by the Taylor Rule. The Taylor Rate is calculated using the GDP Price Deflator (GDPDEF), Real GDP (GDPC1), and Potential Real GDP (GDPPOT), according to the following formula:Taylor Rate = 2% Equilibrium Real Rate + GDP Price Deflator YoY + 0.5 × (GDP Price Deflator YoY − 2% Inflation Target) + 0.5 × ((Real GDP − Potential Real GDP) / Potential Real GDP) × 100
A negative gap indicates that the federal funds rate is more accommodative than the rule prescribes, while a positive gap indicates that the federal funds rate is less accommodative than the rule prescribes. In March 2022, the gap was −1204 bps, substantially below the −70 bps historical median, which signaled tightening. In August 2024, the gap was +1 bp, which signaled holding rates unchanged.
Indicator 4: Bank Loans and Leases YoY
Bank Loans and Leases YoY measures the annual growth in Commercial Bank Loans and Leases (
LOANS). Faster credit growth generally indicates stronger economic activity in the private sector, while slower credit growth generally indicates weaker economic activity in the private sector. In March 2022, lending was growing at +5.7% YoY, below the +7.6% historical median, which signaled holding rates unchanged. In August 2024, lending was growing at +2.4% YoY, which signaled easing.Indicator 5: Broad M2 Money Supply YoY
Broad M2 Money Supply YoY measures the annual growth in the US M2 Money Supply (
M2SL). Faster M2 growth generally indicates stronger inflationary pressure, while slower M2 growth generally indicates weaker inflationary pressure. In March 2022, M2 was growing at +10.6% YoY, substantially above the +5.0% historical median, which signaled tightening. In August 2024, M2 was growing at +2.0% YoY, which signaled easing.Indicator 6: U3 Unemployment − NAIRU
U3 Unemployment − NAIRU measures the difference between the seasonally adjusted U-3 Civilian Unemployment Rate (
UNRATE) and the Non-Accelerating Inflation Rate of Unemployment (NAIRU), proxied by the CBO Noncyclical Rate of Unemployment (NROU). A negative gap generally indicates that the labor market is tight enough to put upward pressure on inflation, while a positive gap generally indicates that the labor market is loose enough to put downward pressure on inflation. In March 2022, the gap was −54 bps, substantially below the +23 bps historical median, which signaled tightening. In August 2024, the gap was −22 bps, which signaled holding rates unchanged.Indicator 7: Hourly Wage − Productivity YoY
Hourly Wage − Productivity YoY measures the difference between the annual growth in Average Hourly Earnings (
AHETPI) and the annual growth in Labor Productivity (OPHNFB). A higher gap generally indicates stronger wage-driven inflationary pressure, while a lower gap generally indicates weaker wage-driven inflationary pressure. In March 2022, the gap was +791 bps, substantially above the +144 bps historical median, which signaled tightening. In August 2024, the gap was +128 bps, which signaled holding rates unchanged.Indicator 8: Brent Crude Spot Price YoY
Brent Crude Spot Price YoY measures the annual change in Brent Crude Oil Spot Prices (
DCOILBRENTEU). Rising oil prices generally increase inflationary pressure, while falling oil prices generally reduce inflationary pressure. In March 2022, prices were increasing at +71.8% YoY, substantially above the +10.5% historical median, which signaled tightening. In August 2024, prices were declining at −13.5% YoY, which signaled easing.Indicator 9: 10Y Breakeven Inflation Rate
10Y Breakeven Inflation Rate measures the difference between the 10-Year Treasury Constant Maturity Yield (
DGS10) and the 10-Year Treasury Inflation-Indexed Yield (DFII10). A wider spread generally suggests higher long-term inflation expectations, while a narrower spread generally suggests lower long-term inflation expectations. In March 2022, the breakeven rate was 2.6%, above the 2.3% historical median, which signaled tightening. In August 2024, the breakeven rate was 2.2%, which signaled holding rates unchanged.Indicator 10: Federal Funds Futures
30-Day Federal Funds Futures (
ZQ1!) are monthly contracts priced at 100 minus the market-implied average Effective Federal Funds Rate (DFF) for each contract month. The open-source Federal Funds Forecast indicator translates these futures prices into a forward-looking path for the federal funds rate, showing the approximate number of rate hikes or cuts expected by the market. In March 2022, futures implied +181 bps of tightening over the following 15 months, equivalent to approximately 7.2 rate hikes. In August 2024, futures implied −217 bps of easing over the following 15 months, equivalent to approximately 8.7 rate cuts.In summary, nine of the ten indicators signaled that policy should be tightened in March 2022, while one signaled holding rates unchanged. Federal funds futures priced in approximately 7.2 rate hikes, ahead of the subsequent +525 bps hiking cycle. By August 2024, six of the ten indicators signaled that policy should be eased, while four signaled holding rates unchanged. Futures priced in approximately 8.7 rate cuts, ahead of the subsequent −175 bps cutting cycle. Together, these ten indicators provide investors with a systematic framework for anticipating the Federal Reserve’s policy rate. While these indicators have historically provided valuable insights, investors should remain mindful that historical relationships and market-implied expectations evolve as economic conditions, inflation dynamics, and Federal Reserve policy responses change over time.

免責聲明
這些資訊和出版物並非旨在提供,也不構成TradingView提供或認可的任何形式的財務、投資、交易或其他類型的建議或推薦。請閱讀使用條款以了解更多資訊。