
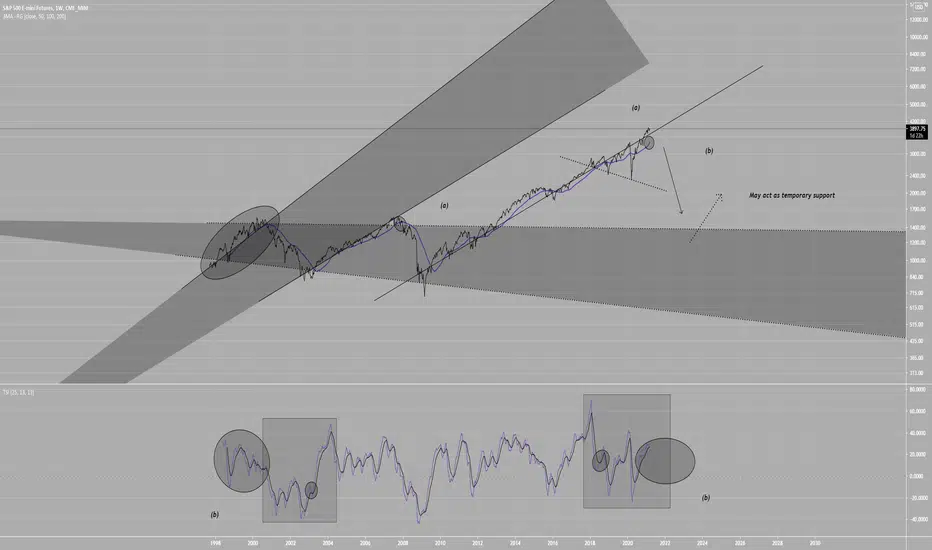
(a) is the 50MA, it can be seen to be curling upwards
and the comparison point (a) shows this ends in a bearish outcome
(b) is a similar points on TSI where I expect a reoccurrence of the pattern in oval to occur, likely acting bearishly.
As i have said before, assess the situation based on impact
2008 banking crisis the market collapsed
2020 COVID? Upward movement seems unjustified.
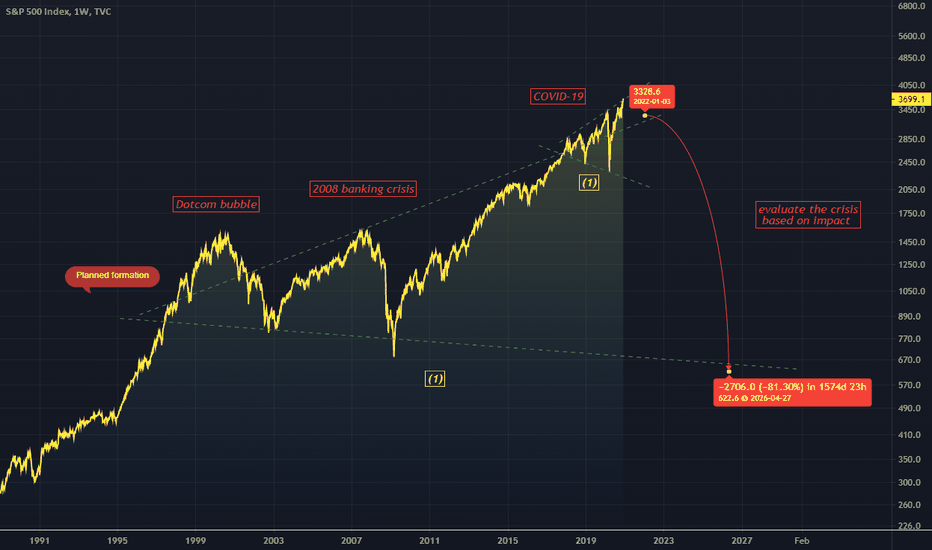
Here is a chart that further explains that philosophy.
I know the charts are kinda similar but I wanted to restate this for those unaware..
and the comparison point (a) shows this ends in a bearish outcome
(b) is a similar points on TSI where I expect a reoccurrence of the pattern in oval to occur, likely acting bearishly.
As i have said before, assess the situation based on impact
2008 banking crisis the market collapsed
2020 COVID? Upward movement seems unjustified.
Here is a chart that further explains that philosophy.
I know the charts are kinda similar but I wanted to restate this for those unaware..

免責聲明
這些資訊和出版物並非旨在提供,也不構成TradingView提供或認可的任何形式的財務、投資、交易或其他類型的建議或推薦。請閱讀使用條款以了解更多資訊。