
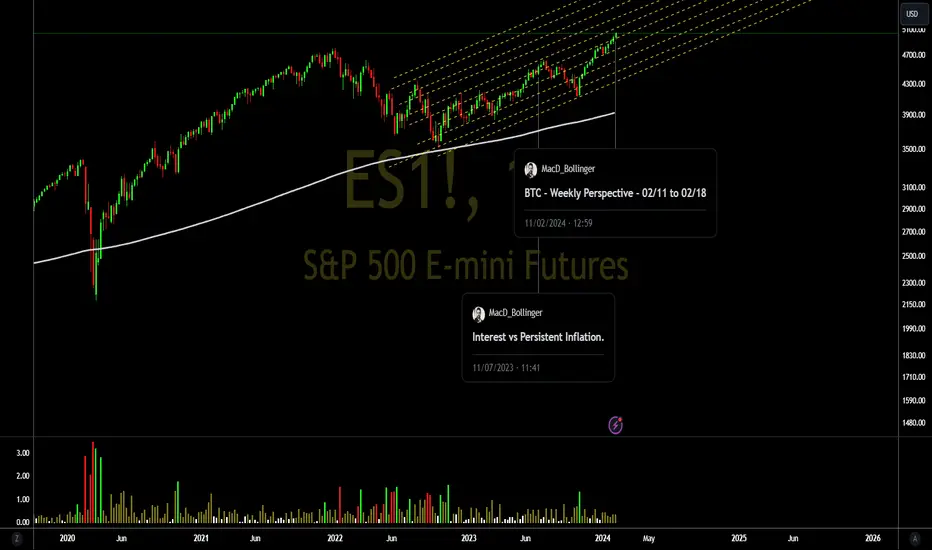
Considering the projection outlined for the future SPX in a previous analysis, I realize that the target pointed out by SETUP on the long-term chart has been reached.
Therefore, I think we have nowhere else to go up without at least having a small correction towards the 4685 region if I only consider the graphical analysis. See the image below.

Despite "reaching" the target, SETUP still shows that the index has a small strength to surpass this mark and reach the 5058 region, which can be seen as a buying trap for the most unsuspecting trader.
Coming to the short-term chart, the SETUP used indicates that we are in an extremely overbought region, therefore, it shows that the index is losing strength and that it really needs to make a correction. See below.

Do your analysis and it's good business.
Be aware, if you buy, use stop loss!
See other graphical analyzes below.
Therefore, I think we have nowhere else to go up without at least having a small correction towards the 4685 region if I only consider the graphical analysis. See the image below.
Despite "reaching" the target, SETUP still shows that the index has a small strength to surpass this mark and reach the 5058 region, which can be seen as a buying trap for the most unsuspecting trader.
Coming to the short-term chart, the SETUP used indicates that we are in an extremely overbought region, therefore, it shows that the index is losing strength and that it really needs to make a correction. See below.
Do your analysis and it's good business.
Be aware, if you buy, use stop loss!
See other graphical analyzes below.

免責聲明
這些資訊和出版物並非旨在提供,也不構成TradingView提供或認可的任何形式的財務、投資、交易或其他類型的建議或推薦。請閱讀使用條款以了解更多資訊。