
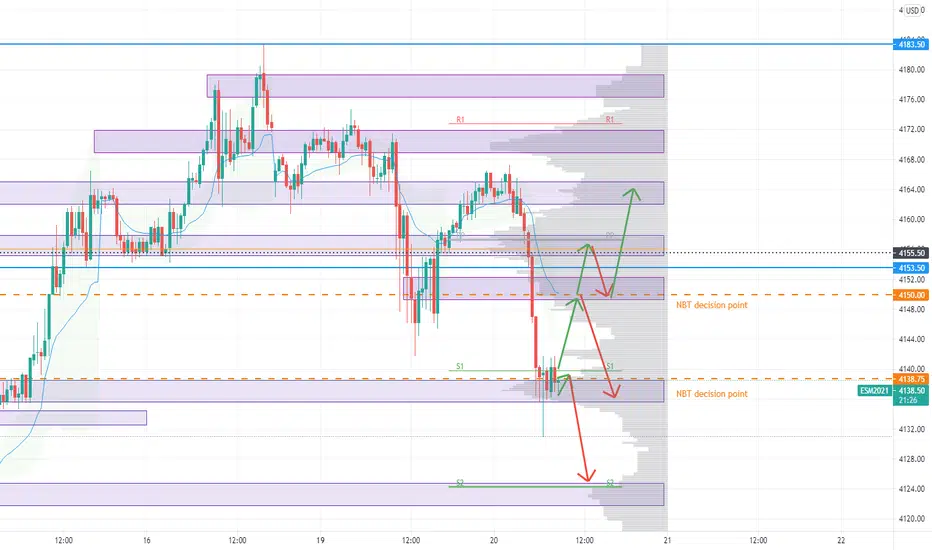
These zones were created by combining several indicators, as well as Fibonacci and volume profiles.
I started by laying out 2-3 point spread rectangles on high volume nodes on the volume profile , and then refined those zones based on previous consolidations. I then added overnight/intraday ranges levels, highs and lows. I mapped out auto-fib retracement levels (as well as reversed auto-fib levels), and 1hr woody pivots on a 1hr timeframe. I switched to standard pivots and mapped those as well. With all of these levels marked, I looked for areas where they were grouped and further refined the rectangles. I also noted where the 34/50 ema cloud was in relation to the zones.
I started by laying out 2-3 point spread rectangles on high volume nodes on the volume profile , and then refined those zones based on previous consolidations. I then added overnight/intraday ranges levels, highs and lows. I mapped out auto-fib retracement levels (as well as reversed auto-fib levels), and 1hr woody pivots on a 1hr timeframe. I switched to standard pivots and mapped those as well. With all of these levels marked, I looked for areas where they were grouped and further refined the rectangles. I also noted where the 34/50 ema cloud was in relation to the zones.

免責聲明
這些資訊和出版物並非旨在提供,也不構成TradingView提供或認可的任何形式的財務、投資、交易或其他類型的建議或推薦。請閱讀使用條款以了解更多資訊。
免責聲明
這些資訊和出版物並非旨在提供,也不構成TradingView提供或認可的任何形式的財務、投資、交易或其他類型的建議或推薦。請閱讀使用條款以了解更多資訊。