
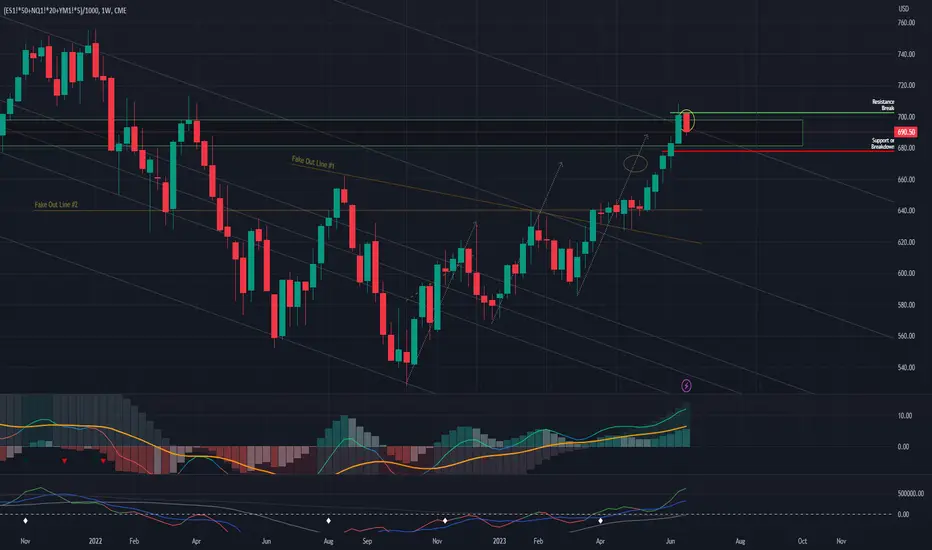
The combined US indexes had spiked as expected, and hit the upside target. This came with good technical indicator support. But the caveat is that the candlestick looks like a dark cloud cover pattern. In this type of pattern, a gap up is reversed and a close is below the halfway mark of the previous candle body. This is exactly what happened so once can expect the outcome of a Dark Cloud Cover to follow, where there is a reversal. Furthermore, the target upside is also the channel Fibonacci 1.62 target.
Therefore, although the MACD and VolDiv appear supportive, it is likely due for a retracement. New support resistances are put in...
Therefore, although the MACD and VolDiv appear supportive, it is likely due for a retracement. New support resistances are put in...

相關出版品
免責聲明
這些資訊和出版物並非旨在提供,也不構成TradingView提供或認可的任何形式的財務、投資、交易或其他類型的建議或推薦。請閱讀使用條款以了解更多資訊。