
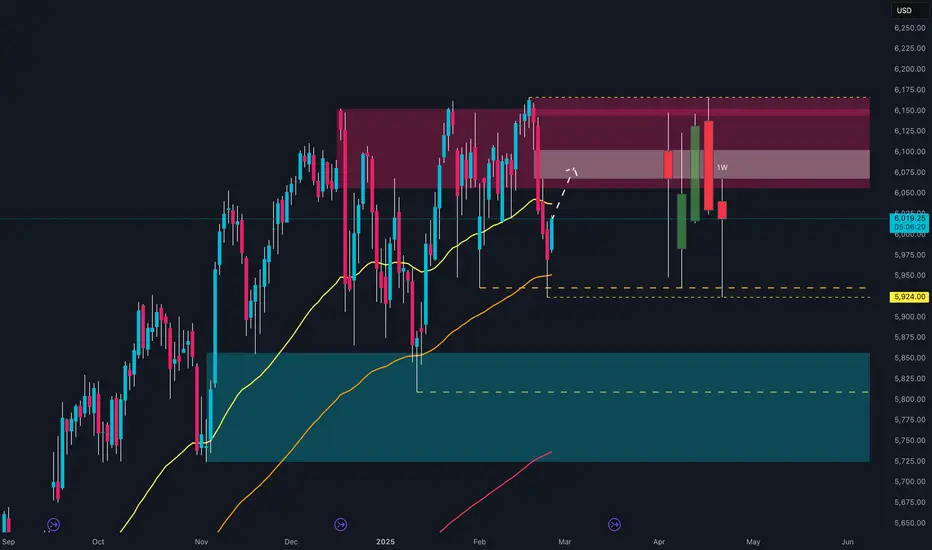
The chart shows a clear rejection from a key resistance zone around 6,150 points, highlighted by the red area. After an attempt to break through, the price faced strong bearish pressure, falling back below the 6,100 level. The current retracement has led the price to test the 50-day moving average (yellow), which has so far provided temporary support. However, breaking this structure could increase the risk of a sharper decline toward the intermediate support at 5,924, marked by the dashed yellow line.
Recent macroeconomic releases, such as the decline in retail sales and weakening consumer confidence, are weighing on market sentiment, increasing pressure on stock indices. Additionally, uncertainty related to tariffs proposed by the U.S. administration is adding volatility, with investors showing signs of risk aversion. If the price fails to quickly recover the 6,100-6,150 area, the next bearish target could be the more structured support zone at 5,850-5,800, identified by the lower blue area.
In summary, the technical structure reflects a moment of uncertainty with a clear rejection from the weekly resistance. A recovery above 6,100 could bring buyers back in control, while further weakness would open the door to new declines toward lower support levels.
Recent macroeconomic releases, such as the decline in retail sales and weakening consumer confidence, are weighing on market sentiment, increasing pressure on stock indices. Additionally, uncertainty related to tariffs proposed by the U.S. administration is adding volatility, with investors showing signs of risk aversion. If the price fails to quickly recover the 6,100-6,150 area, the next bearish target could be the more structured support zone at 5,850-5,800, identified by the lower blue area.
In summary, the technical structure reflects a moment of uncertainty with a clear rejection from the weekly resistance. A recovery above 6,100 could bring buyers back in control, while further weakness would open the door to new declines toward lower support levels.

Nicola Capiotto | EdgeTradingJourney
I document my trading around work and triathlon.
I document my trading around work and triathlon.
免責聲明
這些資訊和出版物並非旨在提供,也不構成TradingView提供或認可的任何形式的財務、投資、交易或其他類型的建議或推薦。請閱讀使用條款以了解更多資訊。
Nicola Capiotto | EdgeTradingJourney
I document my trading around work and triathlon.
I document my trading around work and triathlon.
免責聲明
這些資訊和出版物並非旨在提供,也不構成TradingView提供或認可的任何形式的財務、投資、交易或其他類型的建議或推薦。請閱讀使用條款以了解更多資訊。