
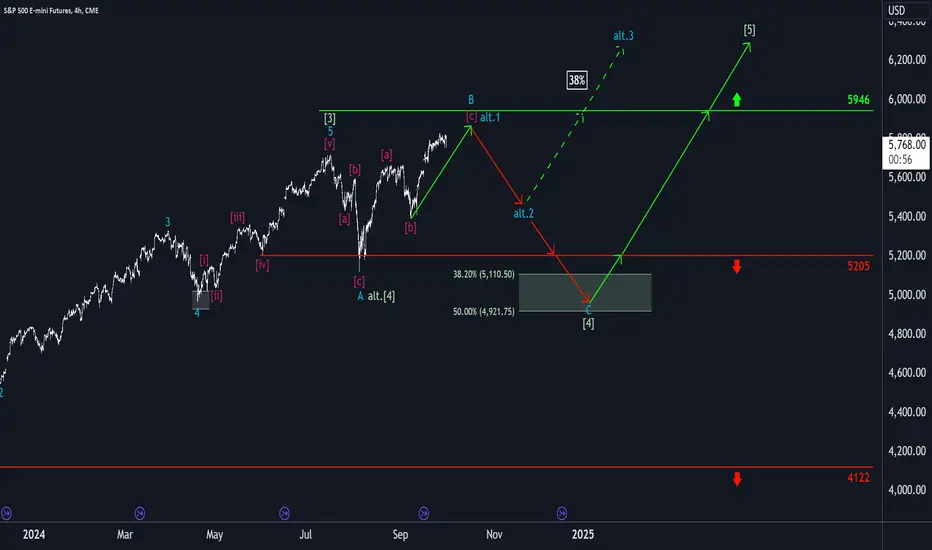
We still give the S&P more room and time to complete its turquoise wave B, which should primarily peak below the resistance at 5946 points. If the index breaches this level, we will have to assume that the larger green wave alt.(4) has already bottomed out. We consider this alternative scenario 38% likely. However, we primarily expect the S&P to fall into our green Target Zone (coordinates: 5110 – 4921 points) after reaching the upcoming top of wave B. This range is where the regular green wave (4) should be completed. Thereafter, we expect the upward movement to continue, with wave (5) finally breaking above 5946 points.

📊 Daily market insights combining macro + Elliott Wave analysis
🚀 Spot trends early with momentum, sentiment & price structure
🌐 Join thousands trading smarter at hkcmglobal.com
🚀 Spot trends early with momentum, sentiment & price structure
🌐 Join thousands trading smarter at hkcmglobal.com
免責聲明
這些資訊和出版物並非旨在提供,也不構成TradingView提供或認可的任何形式的財務、投資、交易或其他類型的建議或推薦。請閱讀使用條款以了解更多資訊。
📊 Daily market insights combining macro + Elliott Wave analysis
🚀 Spot trends early with momentum, sentiment & price structure
🌐 Join thousands trading smarter at hkcmglobal.com
🚀 Spot trends early with momentum, sentiment & price structure
🌐 Join thousands trading smarter at hkcmglobal.com
免責聲明
這些資訊和出版物並非旨在提供,也不構成TradingView提供或認可的任何形式的財務、投資、交易或其他類型的建議或推薦。請閱讀使用條款以了解更多資訊。