
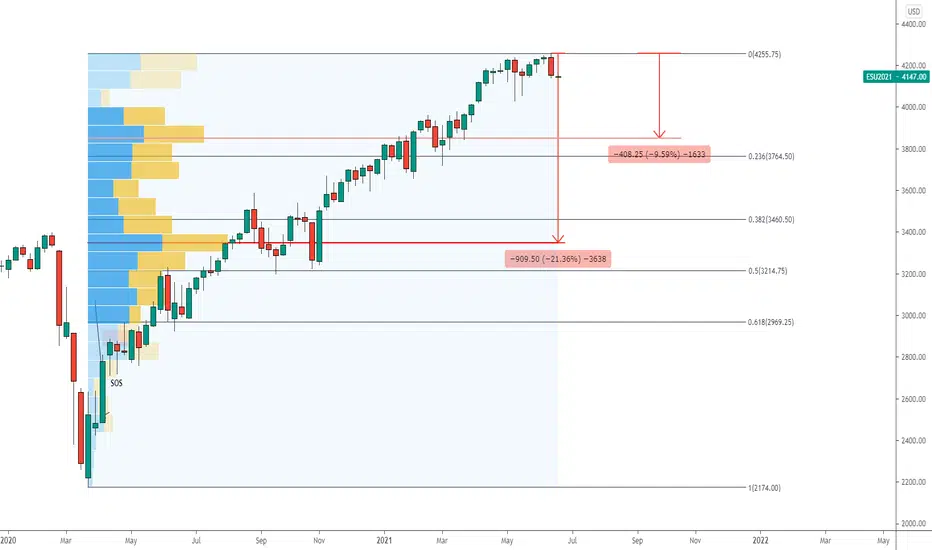
After a strong sell off -59pts or -1.39% (supply) for S&P 500 on last Friday, 18 June 2021, this is a potential start of a market correction.
Here are 2 key support levels to mark on the charts if index continues to fall.
1st Level: 3,850
High Volume Area
Fibo Retracement of 23.6%
10% fall from Peak
2nd Level: 3,400
High Volume Area
Fibo Retracement of 38.2%
20% fall from Peak
Here are 2 key support levels to mark on the charts if index continues to fall.
1st Level: 3,850
High Volume Area
Fibo Retracement of 23.6%
10% fall from Peak
2nd Level: 3,400
High Volume Area
Fibo Retracement of 38.2%
20% fall from Peak

免責聲明
這些資訊和出版物並非旨在提供,也不構成TradingView提供或認可的任何形式的財務、投資、交易或其他類型的建議或推薦。請閱讀使用條款以了解更多資訊。
免責聲明
這些資訊和出版物並非旨在提供,也不構成TradingView提供或認可的任何形式的財務、投資、交易或其他類型的建議或推薦。請閱讀使用條款以了解更多資訊。