
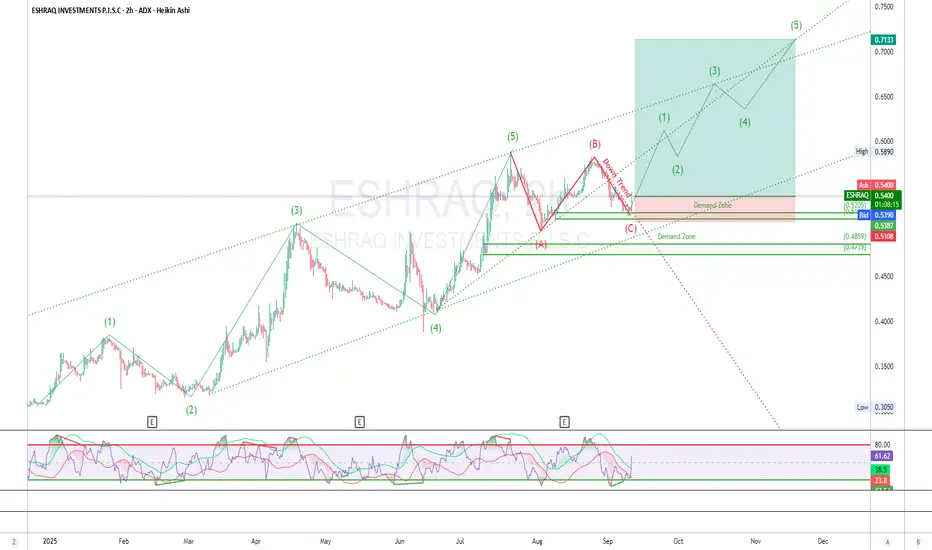
ESHRAQ has been moving in a clear Elliott Wave cycle — strong impulsive legs followed by corrective retracements. The chart shows a completed 5-wave impulse (green count), followed by an ABC correction (red count).
Currently, price is consolidating around 0.52–0.54, right above the demand zone at 0.48–0.51. This area is acting as the potential launchpad for the next bullish wave.
📊 Performance Recap:
1M: +12% (holding support, sideways structure)
3M: +40% (impulse + retracement)
YTD: +75% (strong trend since early 2025)
🔀 Trend & Structure:
Primary Trend: Bullish (higher highs + higher lows intact)
Short-term: Corrective, inside ABC pattern
Key Break: Break above the trend line confirms continuation into impulsive leg/new wave
Elliott Wave Count:
Completed Wave (1)-(5) up to July 21st
Ongoing ABC correction: Currently ending Wave (C) near demand zone
Next phase expected: Impulse Wave (1)-(5) toward 0.71+
🟩 Key Supply/Demand Zones:
Demand Zone: 0.48 – 0.51 ✅ (accumulation/buy area)
Breakout Confirmation: 0.55+
Target Area: 0.70 – 0.72 (wave 5)
RSI divergence aligns with momentum and accumulation
🎯 Trade Setup:
Entry: 0.51–0.54 (demand zone accumulation/Breakout)
Stop Loss: 0.47 (below demand "invalidation")
Take Profit: 0.71–0.72 (Wave 5)
Risk/Reward: ~3.5R
Max Risk: 1–3% of trading capital
🧭 Trade Management:
Move SL → BE once price clears 0.58
Scale out at 0.65 partial, ride remainder to 0.71
If demand zone breaks, wait for deeper retest near 0.45 before re-entry
"Markets move in waves, but only the patient catch the tide."
⚠️ Disclaimer:
This analysis is for educational purposes only and not financial advice. ADX small/mid-cap names can be illiquid and volatile — trade with strict risk management.

By Dubai Traders Hub
Follow us on X , YouTube, and Join our Telegram Channel
Follow us on X , YouTube, and Join our Telegram Channel
免責聲明
這些資訊和出版物並非旨在提供,也不構成TradingView提供或認可的任何形式的財務、投資、交易或其他類型的建議或推薦。請閱讀使用條款以了解更多資訊。
By Dubai Traders Hub
Follow us on X , YouTube, and Join our Telegram Channel
Follow us on X , YouTube, and Join our Telegram Channel
免責聲明
這些資訊和出版物並非旨在提供,也不構成TradingView提供或認可的任何形式的財務、投資、交易或其他類型的建議或推薦。請閱讀使用條款以了解更多資訊。