
etc story is bit intresting
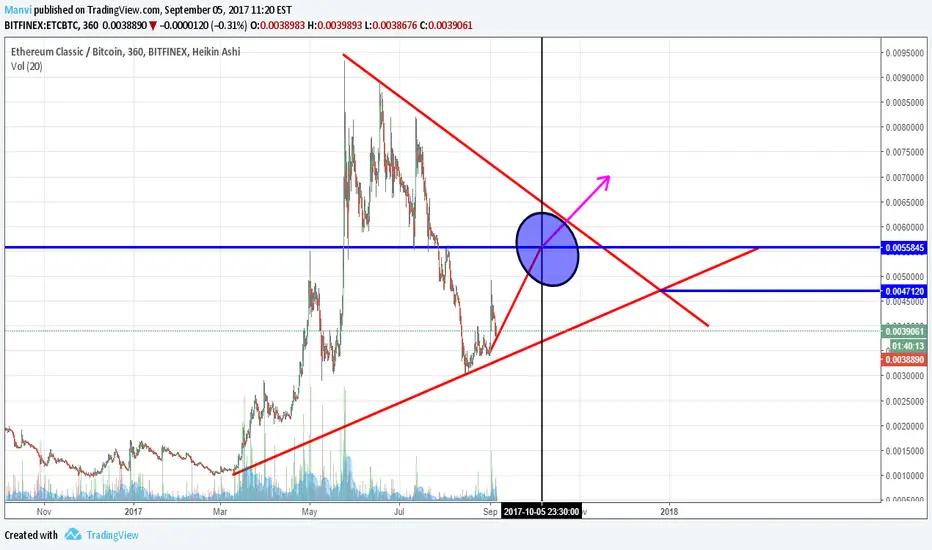
so lets try to undersatnd wht is happenning out here so take a look at chart
etc price in jan,17 = 0.00125-0.00150
etc went in may,17 = 0.00675-0.00912
then again a dip in july,17 = 0.00315-0.00335
now again will go up in 5th oct,17 = 0.00565-0.00595
then etc can pump a big upto 0.012 otherwise next dump will bring etc down to 0.00491 level like (july,17)
and then again same pattern
so lets try to undersatnd wht is happenning out here so take a look at chart
etc price in jan,17 = 0.00125-0.00150
etc went in may,17 = 0.00675-0.00912
then again a dip in july,17 = 0.00315-0.00335
now again will go up in 5th oct,17 = 0.00565-0.00595
then etc can pump a big upto 0.012 otherwise next dump will bring etc down to 0.00491 level like (july,17)
and then again same pattern

免責聲明
這些資訊和出版物並非旨在提供,也不構成TradingView提供或認可的任何形式的財務、投資、交易或其他類型的建議或推薦。請閱讀使用條款以了解更多資訊。