
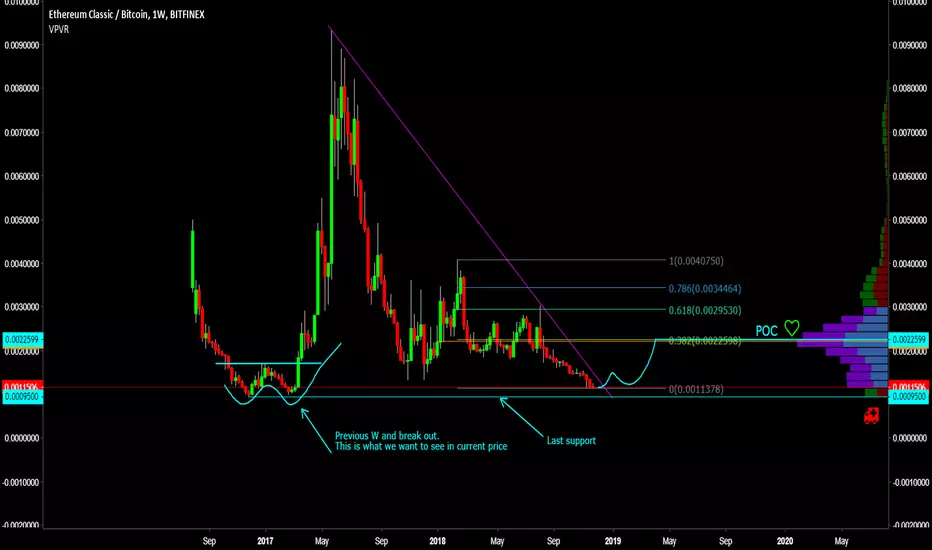
Looking at ETCBTC on a WEEKLY chart.
Rsi oversold
W%R oversold
Bullish divergence on histogram (potential not yet confirmed)
OBV looking ok but would like to see a W or some structure
Looking good to take profits at the POC
Volume profile looking close to full
There are many gaps on the way up that need to be filled
If you want to live life on the edge bids can be set at last support (9500 sats) where i think the bulls will defend this level.
Essentially we want to see price structure ("W"s) and indicator confirmation to know we have a floor, like the previous "W"
This will definitely be on my watch list as it has many fundamental drivers pushing it not to mention a potentially good looking chart.
Don't forget to hit the like button or follow me on Trading View for more chart analysis :)
Rsi oversold
W%R oversold
Bullish divergence on histogram (potential not yet confirmed)
OBV looking ok but would like to see a W or some structure
Looking good to take profits at the POC
Volume profile looking close to full
There are many gaps on the way up that need to be filled
If you want to live life on the edge bids can be set at last support (9500 sats) where i think the bulls will defend this level.
Essentially we want to see price structure ("W"s) and indicator confirmation to know we have a floor, like the previous "W"
This will definitely be on my watch list as it has many fundamental drivers pushing it not to mention a potentially good looking chart.
Don't forget to hit the like button or follow me on Trading View for more chart analysis :)

免責聲明
這些資訊和出版物並非旨在提供,也不構成TradingView提供或認可的任何形式的財務、投資、交易或其他類型的建議或推薦。請閱讀使用條款以了解更多資訊。
免責聲明
這些資訊和出版物並非旨在提供,也不構成TradingView提供或認可的任何形式的財務、投資、交易或其他類型的建議或推薦。請閱讀使用條款以了解更多資訊。