
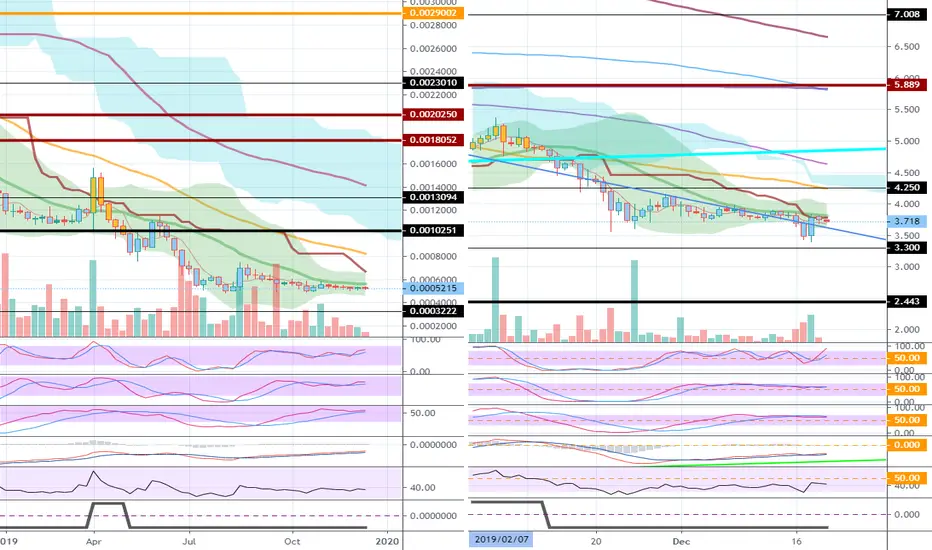
On the ETCBTC chart,
Below 0.0010251 is a long-term investment area.
In the ETCUSD chart,
It is moving around the downtrend line.
You should check if you can move outside of the downward trend line.
----------------
It is expected to take a long time to raise prices in the normal market flow.
Below 0.0010251 is a long-term investment area.
In the ETCUSD chart,
It is moving around the downtrend line.
You should check if you can move outside of the downward trend line.
----------------
It is expected to take a long time to raise prices in the normal market flow.

[Practical trading strategy using HA-MS and SBOD]
youtu.be/aceN1AttX1Y
youtu.be/aceN1AttX1Y
相關出版品
免責聲明
這些資訊和出版物並非旨在提供,也不構成TradingView提供或認可的任何形式的財務、投資、交易或其他類型的建議或推薦。請閱讀使用條款以了解更多資訊。
[Practical trading strategy using HA-MS and SBOD]
youtu.be/aceN1AttX1Y
youtu.be/aceN1AttX1Y
相關出版品
免責聲明
這些資訊和出版物並非旨在提供,也不構成TradingView提供或認可的任何形式的財務、投資、交易或其他類型的建議或推薦。請閱讀使用條款以了解更多資訊。