
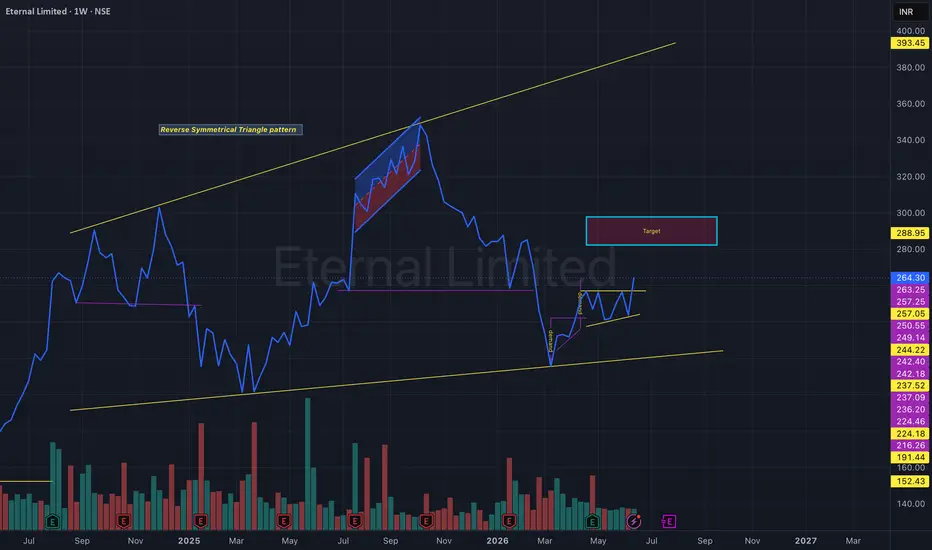
Eternal Ltd. is trading within a broad Reverse Symmetrical Triangle pattern, with price recently bouncing from the lower boundary of the structure. After a sharp correction, the stock has started forming a smaller rising consolidation near support, indicating that buyers are gradually regaining control.
The current setup suggests accumulation after the decline. A decisive breakout above the immediate resistance zone could trigger the next leg higher toward the highlighted target area around ₹285–₹295.
Technical Observations:
🔹 Price respected the lower boundary of the larger triangle structure
🔹 Smaller ascending consolidation developing near support
🔹 Higher lows indicate improving momentum
🔹 Recovery phase underway after a deep correction
🔹 Breakout above resistance can accelerate upside movement
Trading Plan:
✅ Bullish above ₹257–₹263 breakout zone
🎯 Target Zone: ₹285–₹295
🛑 Support Zone: ₹242–₹245
The broader structure remains constructive as long as the lower trendline support holds. Sustained buying and volume expansion may confirm the continuation of the recovery move.
Disclaimer: This analysis is shared solely for educational purposes and does not constitute investment advice. Please conduct your own research and manage risk appropriately.
The current setup suggests accumulation after the decline. A decisive breakout above the immediate resistance zone could trigger the next leg higher toward the highlighted target area around ₹285–₹295.
Technical Observations:
🔹 Price respected the lower boundary of the larger triangle structure
🔹 Smaller ascending consolidation developing near support
🔹 Higher lows indicate improving momentum
🔹 Recovery phase underway after a deep correction
🔹 Breakout above resistance can accelerate upside movement
Trading Plan:
✅ Bullish above ₹257–₹263 breakout zone
🎯 Target Zone: ₹285–₹295
🛑 Support Zone: ₹242–₹245
The broader structure remains constructive as long as the lower trendline support holds. Sustained buying and volume expansion may confirm the continuation of the recovery move.
Disclaimer: This analysis is shared solely for educational purposes and does not constitute investment advice. Please conduct your own research and manage risk appropriately.

免責聲明
這些資訊和出版物並非旨在提供,也不構成TradingView提供或認可的任何形式的財務、投資、交易或其他類型的建議或推薦。請閱讀使用條款以了解更多資訊。
免責聲明
這些資訊和出版物並非旨在提供,也不構成TradingView提供或認可的任何形式的財務、投資、交易或其他類型的建議或推薦。請閱讀使用條款以了解更多資訊。