
Hello traders,
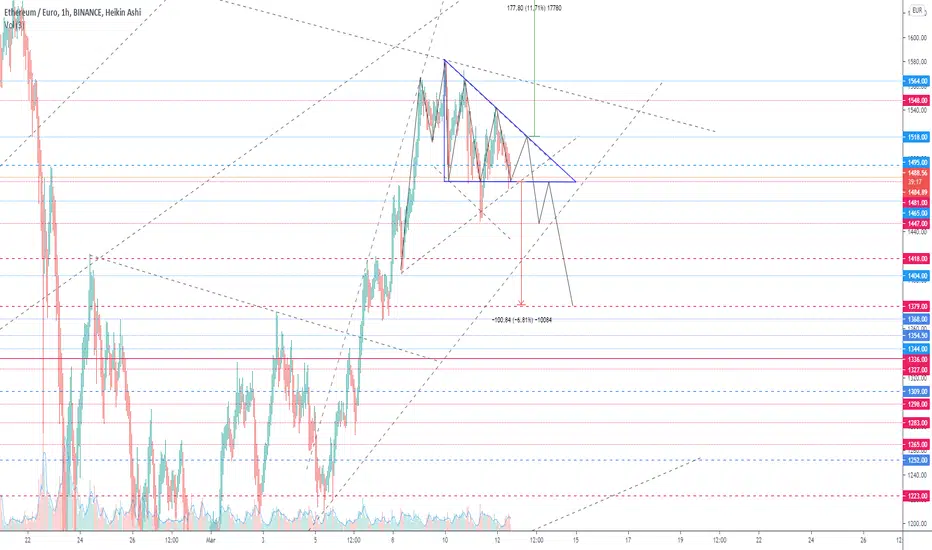
Two triangles have been forming recently: the first one since March 8th around 1400 EUR, and the second one since March 9. The former is a symmetrical triangle, while the latter is a flat bottom triangle. As chart displays, the former is not that clear, while the flat bottomed (drawn in blue) is more evident.
In terms of pricing, considering the height of this flat-bottomed triangle, prices could potentially dip up to 1380 EUR, which coincides with the resistance configured by the inverted head & shoulders pattern, formed and fulfilled on late February. However, one should also consider 1420 EUR as a consolidated resistance in the case the pattern that goes from February 23 to March 05 is a flat top triangle.
If you find this analysis useful, please like, comment, or donate
Two triangles have been forming recently: the first one since March 8th around 1400 EUR, and the second one since March 9. The former is a symmetrical triangle, while the latter is a flat bottom triangle. As chart displays, the former is not that clear, while the flat bottomed (drawn in blue) is more evident.
In terms of pricing, considering the height of this flat-bottomed triangle, prices could potentially dip up to 1380 EUR, which coincides with the resistance configured by the inverted head & shoulders pattern, formed and fulfilled on late February. However, one should also consider 1420 EUR as a consolidated resistance in the case the pattern that goes from February 23 to March 05 is a flat top triangle.
If you find this analysis useful, please like, comment, or donate

免責聲明
這些資訊和出版物並非旨在提供,也不構成TradingView提供或認可的任何形式的財務、投資、交易或其他類型的建議或推薦。請閱讀使用條款以了解更多資訊。