做多
ETHO analysis with buy setup
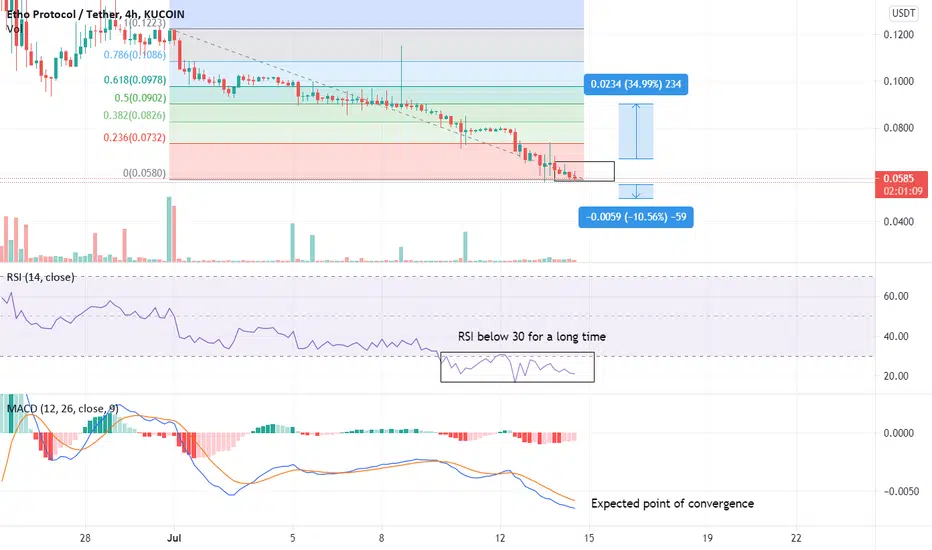
ETHO chart gives us data of future growth. This is supported by several things. Firstly, RSI below 30 point for a long while. Secondly, point of convergence for MACD. Thirdly, decreasing MACD wave. Based on that positive data we can create buy setup like this:
Buy Price: 0.0580-0.0610
TP: 0.0902
SL: 0.0500
Buy Price: 0.0580-0.0610
TP: 0.0902
SL: 0.0500

免責聲明
這些資訊和出版物並非旨在提供,也不構成TradingView提供或認可的任何形式的財務、投資、交易或其他類型的建議或推薦。請閱讀使用條款以了解更多資訊。