
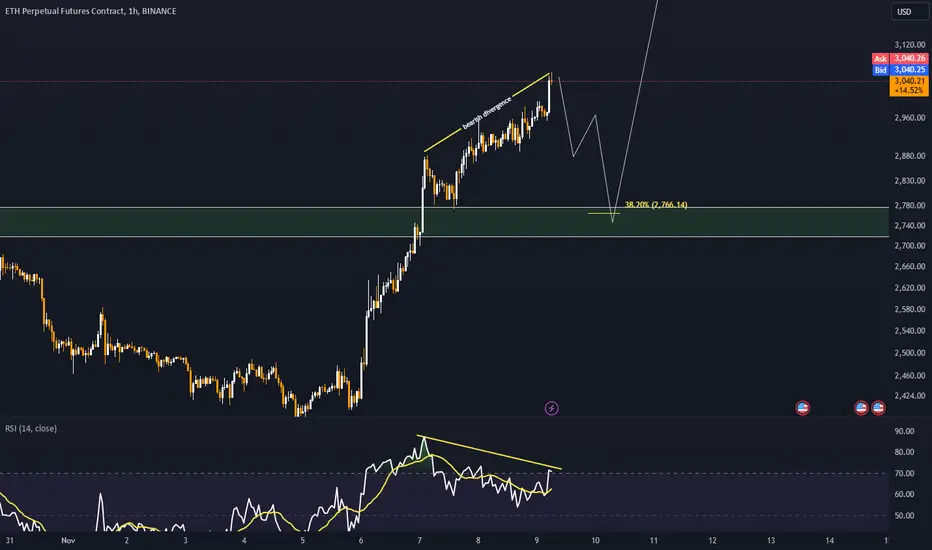
Ethereum is currently displaying signs of a bearish divergence on lower timeframes, a signal that often indicates a potential slowdown in upward momentum and the likelihood of a correction. Despite the bearish signal, the ongoing correction appears to be relatively shallow, suggesting that the underlying bullish structure remains intact.
A retracement to the 0.382 Fibonacci level could present an attractive buying opportunity for traders looking to enter at a lower risk point. This level is often viewed as a key zone for price reactions during corrections, providing a favorable balance between value and momentum for long-term positions.
A retracement to the 0.382 Fibonacci level could present an attractive buying opportunity for traders looking to enter at a lower risk point. This level is often viewed as a key zone for price reactions during corrections, providing a favorable balance between value and momentum for long-term positions.

免責聲明
這些資訊和出版物並非旨在提供,也不構成TradingView提供或認可的任何形式的財務、投資、交易或其他類型的建議或推薦。請閱讀使用條款以了解更多資訊。