 ETHUSD
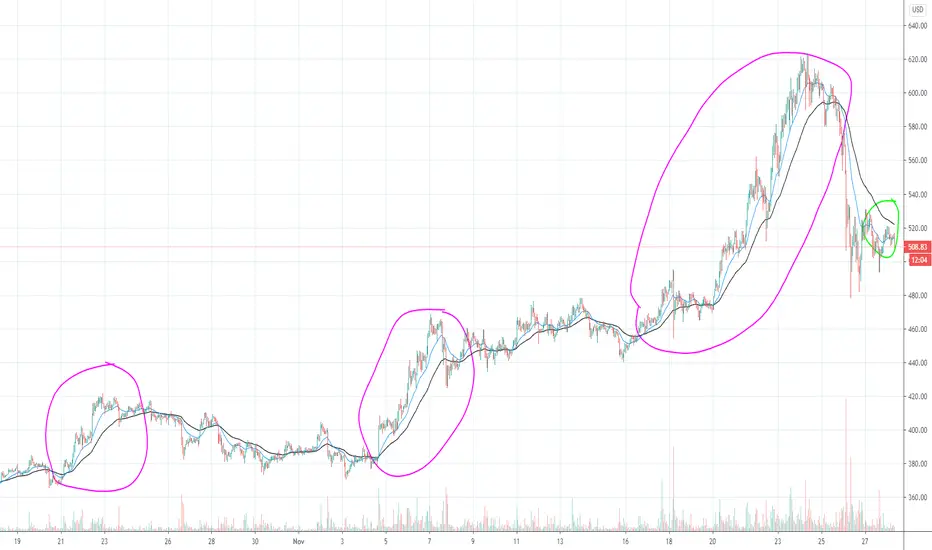
 Here is some more analysis using EMAs looking at 1 hour candles.
You can see with each pink circle, once the EMA20 (blue line) crosses above the EMA50 (black line) we enter a bullish period. This spike continues until EMAs even out and the EMA50 crosses back over. Looking at the green circle we see EMA50 is currently still above, once that turns we are bullish.
These two EMAs are very standard for cryptocurrency analysis.
This is not financial advice! Please trade at your own risk.

免責聲明
這些資訊和出版物並非旨在提供,也不構成TradingView提供或認可的任何形式的財務、投資、交易或其他類型的建議或推薦。請閱讀使用條款以了解更多資訊。
免責聲明
這些資訊和出版物並非旨在提供,也不構成TradingView提供或認可的任何形式的財務、投資、交易或其他類型的建議或推薦。請閱讀使用條款以了解更多資訊。