
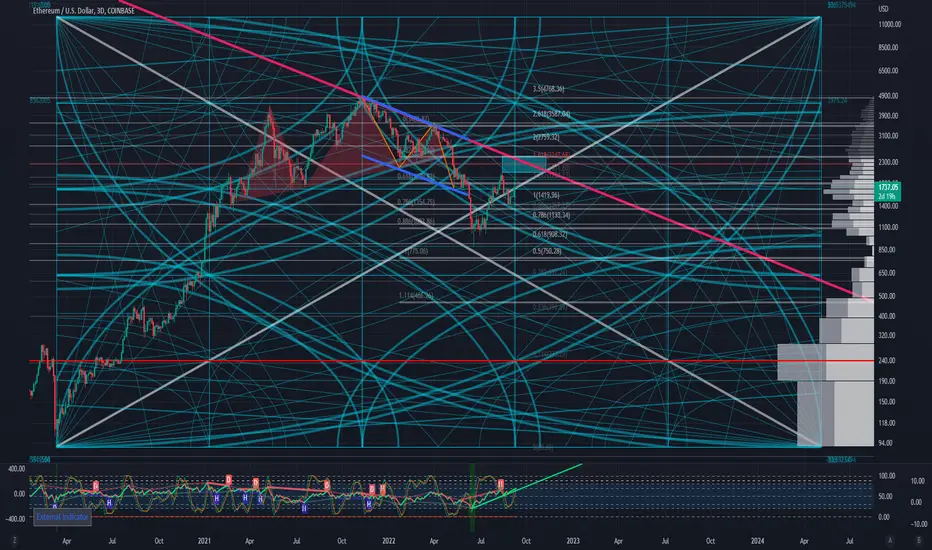
This is an elaboration of my previous idea about the ETH's resistance levels, this time using Gann Square (and arcs).
As can be seen, every arc and fan behaves as support & resistance.
White diagoanl line is Gann 1 x 1. Trends above it are sad to be strong, and trends below it are weak if the square is properly applied.
Overall, this Diagram shows how important but difficult it is for ETH to break through the two key levels: the current price zone and the previous high.
註釋
I attach the linear-scale version of the chart. The main chart is log-scaled.
The linear one is clearer on why I emphasize the resistances.
註釋
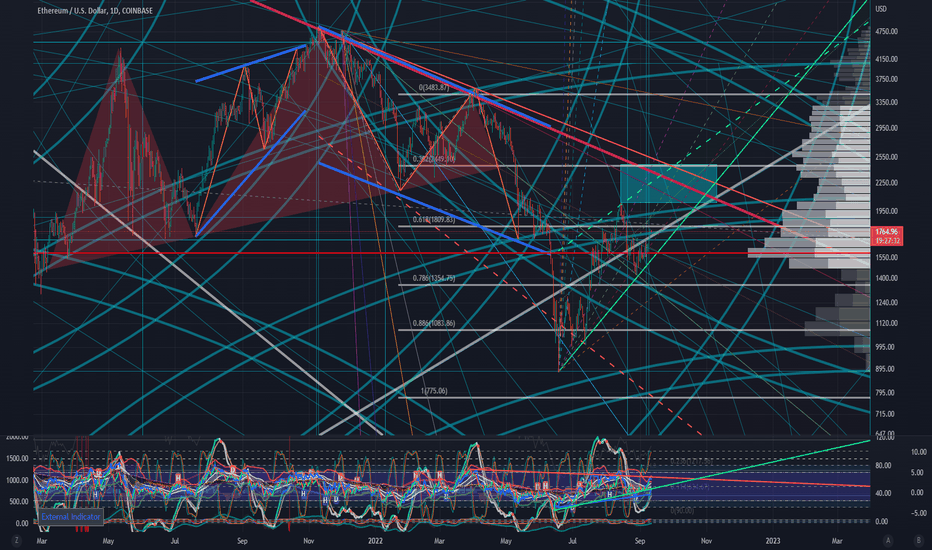
Check out the update.
Visibility improved.

免責聲明
這些資訊和出版物並非旨在提供,也不構成TradingView提供或認可的任何形式的財務、投資、交易或其他類型的建議或推薦。請閱讀使用條款以了解更多資訊。