
📈 ETH/USD Analysis – Potential Pullback Before the Next Bullish Leg
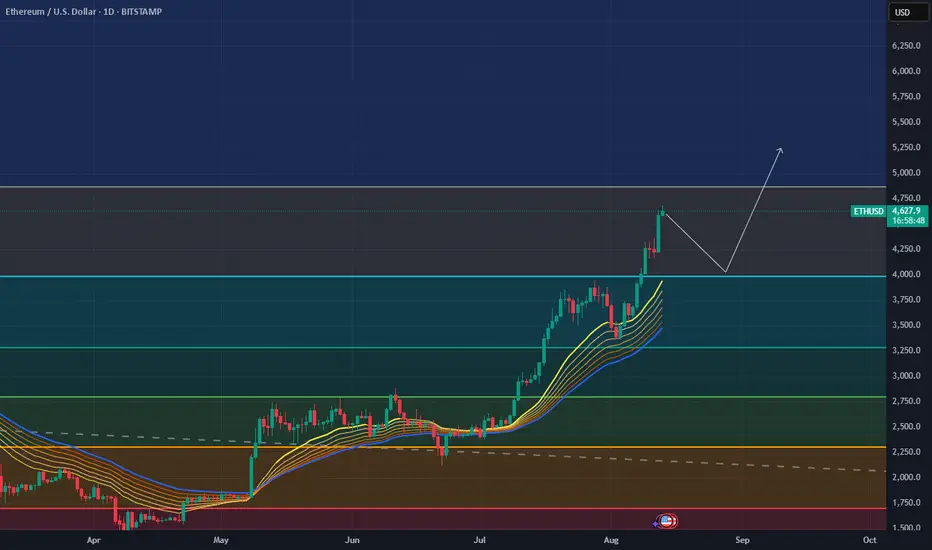
Ethereum is currently trading at $4,622 after an impressive rally. The price has reached a key resistance zone (~$4,700), where a short-term correction could occur.
Key insights:
EMA ribbons show a strong bullish trend – all moving averages are aligned upward and acting as dynamic support.
Fibonacci levels indicate the nearest major support around $4,000 (blue horizontal line).
Scenario: a possible retracement toward the ~$4,000 area, followed by a bounce targeting $5,250 and beyond.
Conclusion:
In the short term, we might see a healthy pullback, but the overall market structure remains strongly bullish. Strategically, watching the reaction at the $4,000 support zone could offer a good buying opportunity.
Ethereum is currently trading at $4,622 after an impressive rally. The price has reached a key resistance zone (~$4,700), where a short-term correction could occur.
Key insights:
EMA ribbons show a strong bullish trend – all moving averages are aligned upward and acting as dynamic support.
Fibonacci levels indicate the nearest major support around $4,000 (blue horizontal line).
Scenario: a possible retracement toward the ~$4,000 area, followed by a bounce targeting $5,250 and beyond.
Conclusion:
In the short term, we might see a healthy pullback, but the overall market structure remains strongly bullish. Strategically, watching the reaction at the $4,000 support zone could offer a good buying opportunity.
交易進行

免責聲明
這些資訊和出版物並非旨在提供,也不構成TradingView提供或認可的任何形式的財務、投資、交易或其他類型的建議或推薦。請閱讀使用條款以了解更多資訊。