
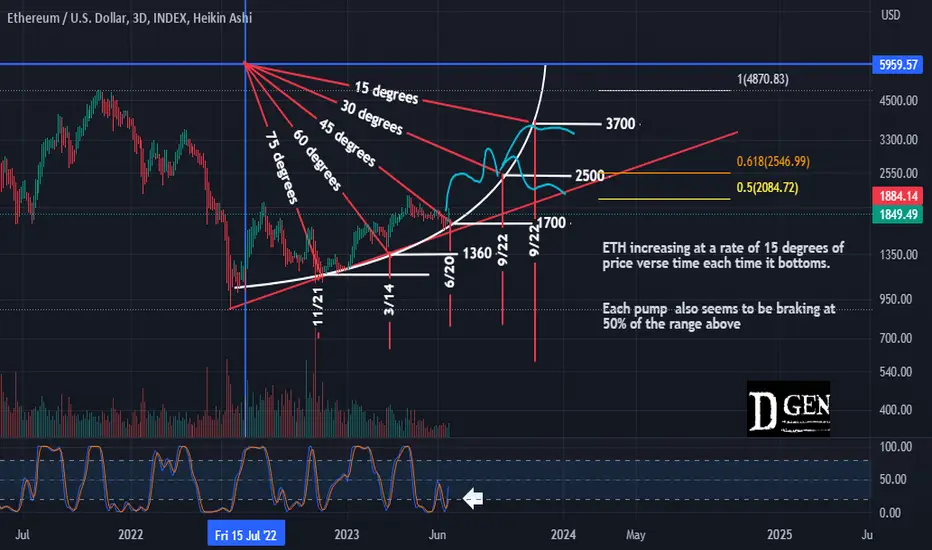
Looking at ETH on a log chart we can see that each time it has pulled back it has put in a higher bottom and each of these bottoms is exactly 15 degrees apart. This a clear indication that there a inreasing rate of momentum.
Each run since the last years bottom also seems to be braking at 50% of the range above.
If the pattern continues this would put the next uptrend target right into the technical golden pocket from the macro high.
At the same time WHEN the pattern brakes its over.
Each run since the last years bottom also seems to be braking at 50% of the range above.
If the pattern continues this would put the next uptrend target right into the technical golden pocket from the macro high.
At the same time WHEN the pattern brakes its over.
註釋
next stop 3700?
免責聲明
這些資訊和出版物並非旨在提供,也不構成TradingView提供或認可的任何形式的財務、投資、交易或其他類型的建議或推薦。請閱讀使用條款以了解更多資訊。
免責聲明
這些資訊和出版物並非旨在提供,也不構成TradingView提供或認可的任何形式的財務、投資、交易或其他類型的建議或推薦。請閱讀使用條款以了解更多資訊。