
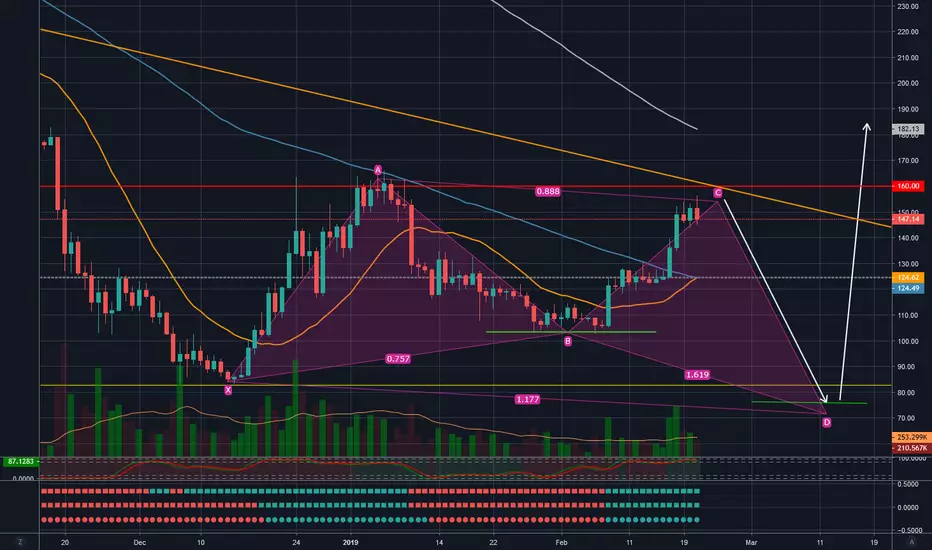
In a previous post, a Bullish Butterfly was developing on the ETH USD Daily Chart at around $103. That pattern still seems to be in play, which may give an indication that if short move down was coming to the recent Bullish Momentum, it would come relatively soon.
The pattern would also indicate a much stronger move in the upcoming months of March and April. I will be watching to see if this pattern plays out and if the $160 and distant downtrend line will act enough resistance to put sellers in play. The pattern seems to qualify, so I will most certainly be interested to see a much stronger move past the distant trend line and points C of the Wing.
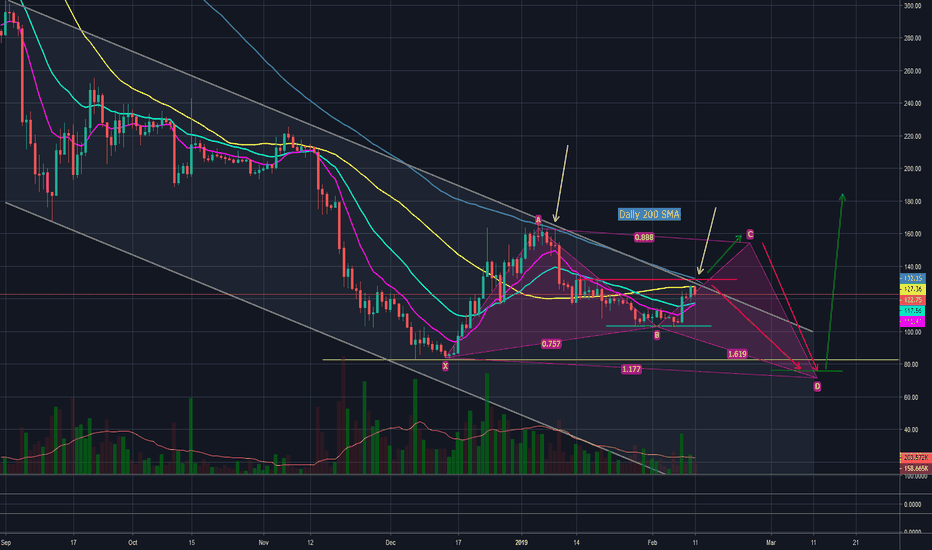
The pattern would also indicate a much stronger move in the upcoming months of March and April. I will be watching to see if this pattern plays out and if the $160 and distant downtrend line will act enough resistance to put sellers in play. The pattern seems to qualify, so I will most certainly be interested to see a much stronger move past the distant trend line and points C of the Wing.
交易進行
Recent Bearish activity hasn't yet broken the minor uptrend line, but the Bullish Butterfly has yet to be invalidated. I anticipate this to move down to the marked area, and then possibly farther down. 
免責聲明
這些資訊和出版物並非旨在提供,也不構成TradingView提供或認可的任何形式的財務、投資、交易或其他類型的建議或推薦。請閱讀使用條款以了解更多資訊。