
Hello everyone, I invite you to review the ETH/USD chart taking into account the interval of one weekend.
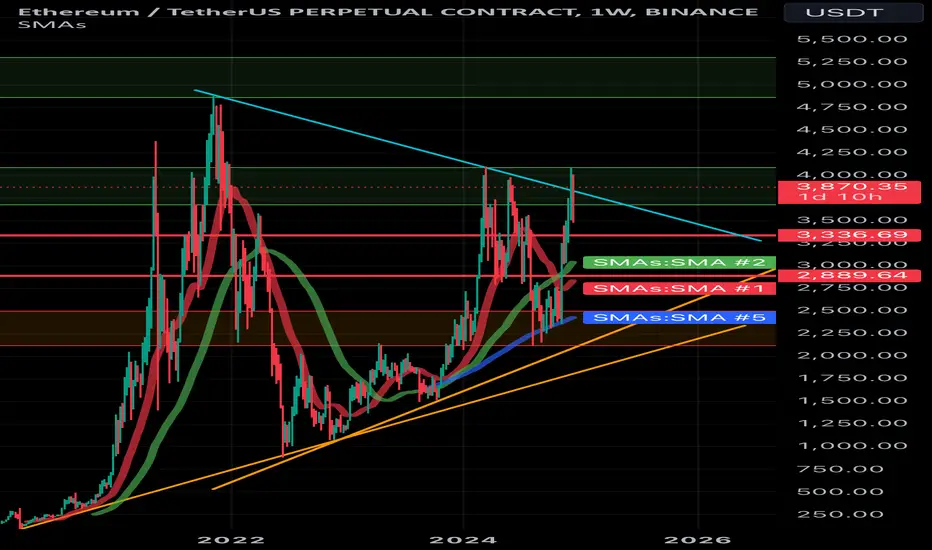
We can observe how the price is struggling to maintain the level of the downward trend line marked in blue.
Moreover, we can see how the price is currently fighting in a strong resistance zone from $3,677 to $4,087, we can see how the upper border of the zone has rejected the price, only when it manages to break out of it positively, the price will move towards the second very strong zone from $4,864 to $5,305 .
When the current resistance zone completely rejects the price and strong declines begin, support is visible at $3,336, then there is support at $2,889, and then a strong support zone is visible from $2,498 to $2,116.
We can observe how the price is struggling to maintain the level of the downward trend line marked in blue.
Moreover, we can see how the price is currently fighting in a strong resistance zone from $3,677 to $4,087, we can see how the upper border of the zone has rejected the price, only when it manages to break out of it positively, the price will move towards the second very strong zone from $4,864 to $5,305 .
When the current resistance zone completely rejects the price and strong declines begin, support is visible at $3,336, then there is support at $2,889, and then a strong support zone is visible from $2,498 to $2,116.

免責聲明
這些資訊和出版物並非旨在提供,也不構成TradingView提供或認可的任何形式的財務、投資、交易或其他類型的建議或推薦。請閱讀使用條款以了解更多資訊。
免責聲明
這些資訊和出版物並非旨在提供,也不構成TradingView提供或認可的任何形式的財務、投資、交易或其他類型的建議或推薦。請閱讀使用條款以了解更多資訊。