
Price Action:
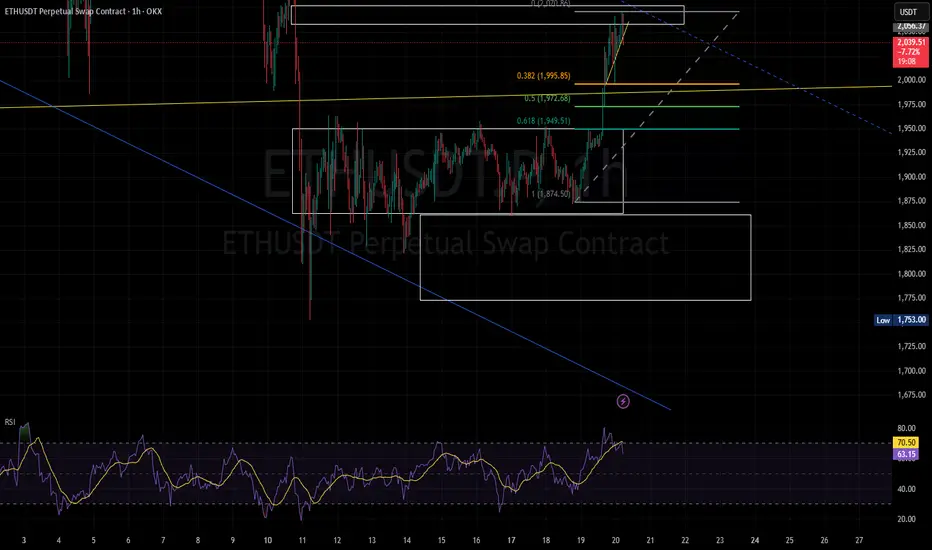
The chart shows ETHUSD trading at 2,041.01, with a recent decline of -3.36 (-0.41%).
The high (HI) for the session was 2,044.00, and the low (L) was 1,664.36.
The price is currently near the session’s high, which suggests some resistance around the 2,044 level.
Trend:
The chart spans from 2009 to 2025, indicating a long-term uptrend for ETHUSD.
However, the recent price action (2024-2025) shows consolidation or a potential pullback, as the price is struggling to break above 2,044.
Key Levels:
Support: The low of 1,664.36 is a strong support level.
Resistance: The high of 2,044.00 is acting as a resistance level. If the price breaks above this, it could target higher levels.
Your short position at 2,037 is just below the resistance, which is a logical entry point for a short trade.
Momentum:
The price is currently in a slight downtrend, as indicated by the -0.41% decline.
The fact that the price is struggling to break above 2,044 suggests bearish momentum in the short term.
The chart shows ETHUSD trading at 2,041.01, with a recent decline of -3.36 (-0.41%).
The high (HI) for the session was 2,044.00, and the low (L) was 1,664.36.
The price is currently near the session’s high, which suggests some resistance around the 2,044 level.
Trend:
The chart spans from 2009 to 2025, indicating a long-term uptrend for ETHUSD.
However, the recent price action (2024-2025) shows consolidation or a potential pullback, as the price is struggling to break above 2,044.
Key Levels:
Support: The low of 1,664.36 is a strong support level.
Resistance: The high of 2,044.00 is acting as a resistance level. If the price breaks above this, it could target higher levels.
Your short position at 2,037 is just below the resistance, which is a logical entry point for a short trade.
Momentum:
The price is currently in a slight downtrend, as indicated by the -0.41% decline.
The fact that the price is struggling to break above 2,044 suggests bearish momentum in the short term.

免責聲明
這些資訊和出版物並非旨在提供,也不構成TradingView提供或認可的任何形式的財務、投資、交易或其他類型的建議或推薦。請閱讀使用條款以了解更多資訊。