
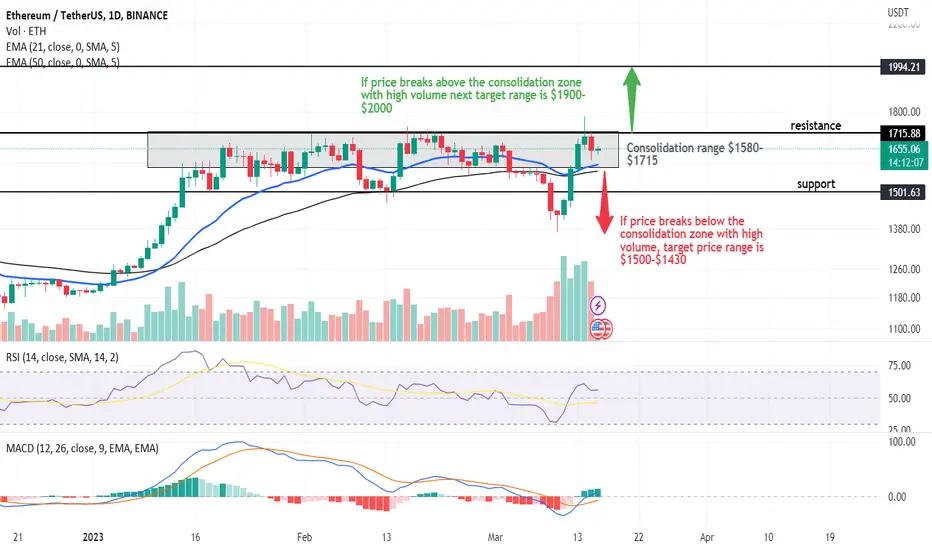
Currently, price is near its support level of $1650. If $1650 support breaks next support level is at $1580. The resistance level is at $1715.
On a daily timeframe, the price is above 21-EMA and 50-EMA.
MACD > MACD line and MACD > 0 : Bullish momentum
RSI>50: Bullish momentum
Note: Studies are for educational purposes only.
We will not be responsible for any of your Profits & Losses.
Please trade with a proper risk management strategy to avoid huge capital loss.

免責聲明
這些資訊和出版物並非旨在提供,也不構成TradingView提供或認可的任何形式的財務、投資、交易或其他類型的建議或推薦。請閱讀使用條款以了解更多資訊。
免責聲明
這些資訊和出版物並非旨在提供,也不構成TradingView提供或認可的任何形式的財務、投資、交易或其他類型的建議或推薦。請閱讀使用條款以了解更多資訊。