
Hello, welcome to this ETH/USDT update by CRYPTO SANDERS.
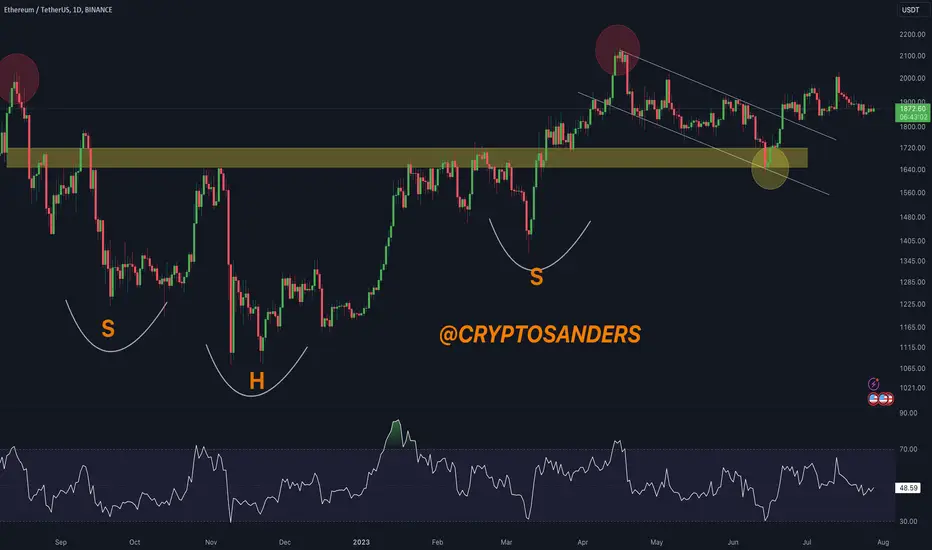
CHART ANALYSIS:- Ethereum (ETH) traded above its own support point at 1,850 on Friday, as the cryptocurrency continued consolidating.
ETH/USD dropped to a bottom at 1,855.32 earlier in today’s session, a day after peaking at 1,878.43.
The price consolidation comes as the RSI failed to move above a current resistance level of 48.00.
As of writing, the index is on the cusp of crossing this line, however, momentum is still relatively weak.
There could likely be a spark later in the day, depending on how traders react to the University of Michigan Consumer Sentiment report.
I have tried to bring the best possible outcome to this chart.
Hit the like button if you like it and share your charts in the comments section.
Thank you
CHART ANALYSIS:- Ethereum (ETH) traded above its own support point at 1,850 on Friday, as the cryptocurrency continued consolidating.
ETH/USD dropped to a bottom at 1,855.32 earlier in today’s session, a day after peaking at 1,878.43.
The price consolidation comes as the RSI failed to move above a current resistance level of 48.00.
As of writing, the index is on the cusp of crossing this line, however, momentum is still relatively weak.
There could likely be a spark later in the day, depending on how traders react to the University of Michigan Consumer Sentiment report.
I have tried to bring the best possible outcome to this chart.
Hit the like button if you like it and share your charts in the comments section.
Thank you

相關出版品
免責聲明
這些資訊和出版物並非旨在提供,也不構成TradingView提供或認可的任何形式的財務、投資、交易或其他類型的建議或推薦。請閱讀使用條款以了解更多資訊。