
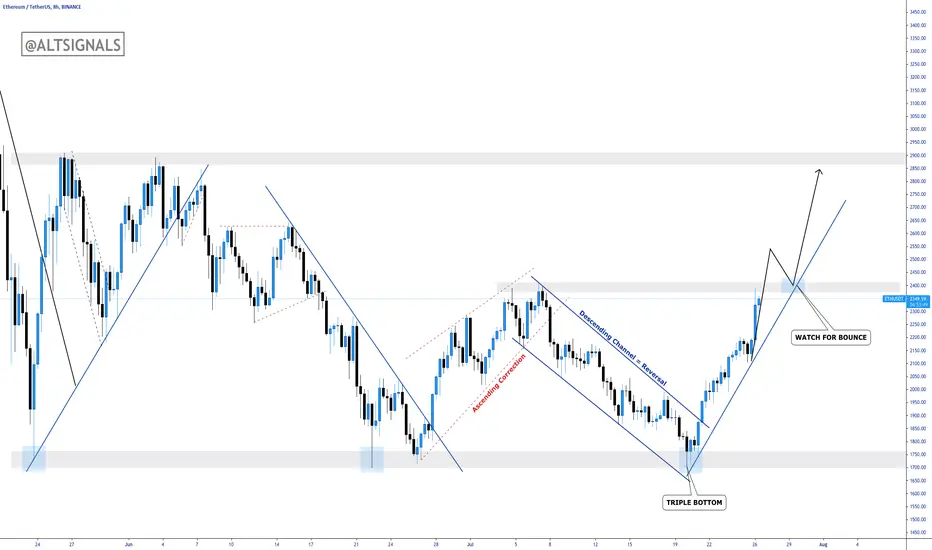
In our last Ethereum analysis, we were short from the break of ascending correction back to the bottom - raw gains of almost 25%!
We saw a triple bottom chart pattern which is a highly probable bearish to bullish reversal pattern. We are now approaching a very interesting level where we can look to add another buy position.
At the 2400 level, price converges with trendline and structure making it a high probability area to buy. Watch for price to clear the 2400 level and get in on the retest.
We saw a triple bottom chart pattern which is a highly probable bearish to bullish reversal pattern. We are now approaching a very interesting level where we can look to add another buy position.
At the 2400 level, price converges with trendline and structure making it a high probability area to buy. Watch for price to clear the 2400 level and get in on the retest.

🥃 Crypto Signals Since 2017 🥃
💎Telegram t.me/AltSignals 💎
📈 Signals/Algos altsignals.io/join 📈
💎Telegram t.me/AltSignals 💎
📈 Signals/Algos altsignals.io/join 📈
相關出版品
免責聲明
這些資訊和出版物並非旨在提供,也不構成TradingView提供或認可的任何形式的財務、投資、交易或其他類型的建議或推薦。請閱讀使用條款以了解更多資訊。
🥃 Crypto Signals Since 2017 🥃
💎Telegram t.me/AltSignals 💎
📈 Signals/Algos altsignals.io/join 📈
💎Telegram t.me/AltSignals 💎
📈 Signals/Algos altsignals.io/join 📈
相關出版品
免責聲明
這些資訊和出版物並非旨在提供,也不構成TradingView提供或認可的任何形式的財務、投資、交易或其他類型的建議或推薦。請閱讀使用條款以了解更多資訊。