
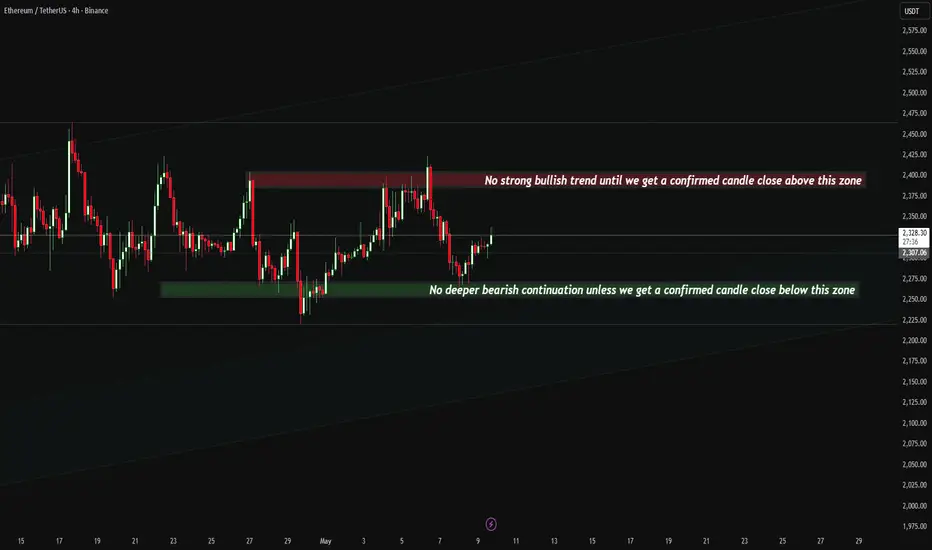
This is the ETH/USDT 4‑hour chart, and the overall picture is clear:
Ethereum remains firmly inside a wide consolidation range, and there is no confirmed breakout yet in either direction.
Let’s go through all major components on the chart.
1. Market Condition: Range‑Bound
ETH has been moving sideways for several days, creating repeated:
Bull Traps at the top
Bear Traps at the bottom
This behavior is typical when:
Liquidity is being collected
Momentum is weak
The market is waiting for a stronger catalyst
So at this stage:
“We are still stuck in a range, and it will likely continue for a while.”
2. Key Observed Bull Traps (Red Labels)
Multiple bull traps appear near the upper resistance band, showing:
Price spikes above the range
Immediate rejection
Strong selling pressure from short‑term traders
This signals that buyers do not yet have enough strength to break the structure.
3. Key Observed Bear Traps (Green Labels)
Repeated bear traps are visible around the support area:
Price dips below range support
Quick reversal upward
Buyers absorbing liquidity aggressively
This indicates that sellers are weak below this range, and breakdown attempts lack follow‑through.
4. Moving Averages
50 EMA (Yellow Line)
Acting as short-term dynamic resistance.
Price tends to reject from it during weak momentum periods.
200 EMA (Blue Line)
Acting as strong dynamic support.
Bear traps often form around this level.
As long as price stays above this EMA, the mid‑term bias remains neutral‑to‑slightly‑bullish.
5. Key Zones on the Chart
A) Upper Supply Zone (Red Region)
Persian text: تا تایید کندلی بالای این نداریم خبری از روند قوی نیست
English Replacement:
“No strong bullish trend until we get a confirmed candle close above this zone.”
This is the key area to watch for:
Strong selling pressure
Bull trap formation
Failed breakouts
A candle close above this level is required for the uptrend to activate.
B) Lower Demand Zone (Green Region)
Persian text: تا تایید کندلی زیر این نداریم خبری از ریزش بیشتر نیست
English Replacement:
“No deeper bearish continuation unless we get a confirmed candle close below this zone.”
This zone represents:
High buy‑side liquidity
Repeated bear trap formations
Strong reaction points
As long as ETH stays above this zone, downside extensions remain unlikely.
6. Indicator Panel (Top‑Right)
Major Trend: Range
Current Trend: Bear
Momentum: Range
BIAS: Neutral
Incoming: Normal Bullish Movement
This combination clearly confirms:
“We are inside a range — not trending.”
And any incoming bullishness is still normal, not strong.
7. Overall Interpretation
Ethereum continues to move inside a well-defined horizontal range, with:
Fake breakouts on both sides
No clear trend dominance
Buyers and sellers cancelling each other out
Weak market momentum
What needs to happen?
Bullish Breakout
A 4H candle close above the upper supply zone
→ unlocks trend continuation toward higher levels.
Bearish Breakdown
A 4H candle close below the demand zone
→ opens room for deeper decline.
Until either happens:
ETH is stuck in a range and will likely continue ranging for a while.
Ethereum remains firmly inside a wide consolidation range, and there is no confirmed breakout yet in either direction.
Let’s go through all major components on the chart.
1. Market Condition: Range‑Bound
ETH has been moving sideways for several days, creating repeated:
Bull Traps at the top
Bear Traps at the bottom
This behavior is typical when:
Liquidity is being collected
Momentum is weak
The market is waiting for a stronger catalyst
So at this stage:
“We are still stuck in a range, and it will likely continue for a while.”
2. Key Observed Bull Traps (Red Labels)
Multiple bull traps appear near the upper resistance band, showing:
Price spikes above the range
Immediate rejection
Strong selling pressure from short‑term traders
This signals that buyers do not yet have enough strength to break the structure.
3. Key Observed Bear Traps (Green Labels)
Repeated bear traps are visible around the support area:
Price dips below range support
Quick reversal upward
Buyers absorbing liquidity aggressively
This indicates that sellers are weak below this range, and breakdown attempts lack follow‑through.
4. Moving Averages
50 EMA (Yellow Line)
Acting as short-term dynamic resistance.
Price tends to reject from it during weak momentum periods.
200 EMA (Blue Line)
Acting as strong dynamic support.
Bear traps often form around this level.
As long as price stays above this EMA, the mid‑term bias remains neutral‑to‑slightly‑bullish.
5. Key Zones on the Chart
A) Upper Supply Zone (Red Region)
Persian text: تا تایید کندلی بالای این نداریم خبری از روند قوی نیست
English Replacement:
“No strong bullish trend until we get a confirmed candle close above this zone.”
This is the key area to watch for:
Strong selling pressure
Bull trap formation
Failed breakouts
A candle close above this level is required for the uptrend to activate.
B) Lower Demand Zone (Green Region)
Persian text: تا تایید کندلی زیر این نداریم خبری از ریزش بیشتر نیست
English Replacement:
“No deeper bearish continuation unless we get a confirmed candle close below this zone.”
This zone represents:
High buy‑side liquidity
Repeated bear trap formations
Strong reaction points
As long as ETH stays above this zone, downside extensions remain unlikely.
6. Indicator Panel (Top‑Right)
Major Trend: Range
Current Trend: Bear
Momentum: Range
BIAS: Neutral
Incoming: Normal Bullish Movement
This combination clearly confirms:
“We are inside a range — not trending.”
And any incoming bullishness is still normal, not strong.
7. Overall Interpretation
Ethereum continues to move inside a well-defined horizontal range, with:
Fake breakouts on both sides
No clear trend dominance
Buyers and sellers cancelling each other out
Weak market momentum
What needs to happen?
Bullish Breakout
A 4H candle close above the upper supply zone
→ unlocks trend continuation toward higher levels.
Bearish Breakdown
A 4H candle close below the demand zone
→ opens room for deeper decline.
Until either happens:
ETH is stuck in a range and will likely continue ranging for a while.

免責聲明
這些資訊和出版物並非旨在提供,也不構成TradingView提供或認可的任何形式的財務、投資、交易或其他類型的建議或推薦。請閱讀使用條款以了解更多資訊。
免責聲明
這些資訊和出版物並非旨在提供,也不構成TradingView提供或認可的任何形式的財務、投資、交易或其他類型的建議或推薦。請閱讀使用條款以了解更多資訊。