
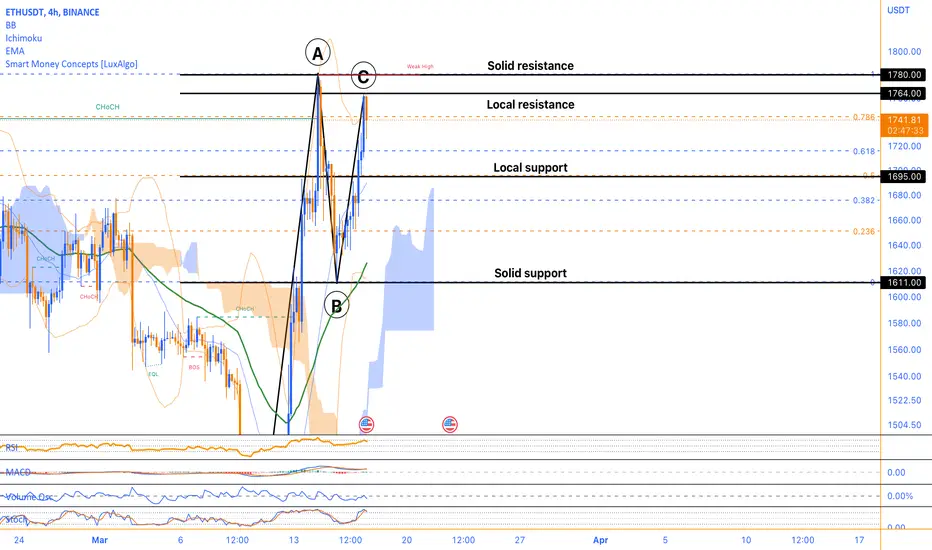
Looking at the Ethereum chart, there are a few key prices that traders should keep an eye on. The current price is $1737, and technical indicators such as the RSI and stochastic oscillator suggest that the asset is currently in a bullish trend. The MACD is also positive, which indicates a strong momentum behind the asset's price movement.
However, there are also potential levels of support and resistance that traders should be aware of. The 0 Fibonacci level at 1611 could be a solid support level for the asset, as it is a significant Fibonacci retracement level. Additionally, the 0.5 Fibonacci level at 1695 could act as a local support level if the price were to experience any dips.
On the other hand, there are also potential levels of resistance to consider. The 1 Fibonacci level at 1780 could act as a solid resistance level for the asset, as it is a significant Fibonacci retracement level and close to the upper Bollinger band at 1764. Additionally, the upper Bollinger band could be a local resistance level to watch.
It is worth noting that the lower Bollinger band at 1615 could provide another level of support for the asset, while the middle Bollinger band at 1689 could provide an indication of the current price range. Furthermore, the volume oscillator is at -10%, which is not a strong indicator either way but is still worth considering.
In conclusion, traders should keep an eye on the potential levels of support and resistance, as well as the technical indicators, to make informed trading decisions. As always, risk management should be a priority to minimize potential losses.

Join the free Telegram channel
💎 Telegram Channel: t.me/MonoCoin_Public
🔔 Bot: t.me/MonoCoinSignal_Bot?start=starter_tv
🌐 Website: MonoCoin.net
⭐️ 5-Star TrustPilot: trustpilot.com/review/monocoin.net
💎 Telegram Channel: t.me/MonoCoin_Public
🔔 Bot: t.me/MonoCoinSignal_Bot?start=starter_tv
🌐 Website: MonoCoin.net
⭐️ 5-Star TrustPilot: trustpilot.com/review/monocoin.net
相關出版品
免責聲明
這些資訊和出版物並非旨在提供,也不構成TradingView提供或認可的任何形式的財務、投資、交易或其他類型的建議或推薦。請閱讀使用條款以了解更多資訊。