
Hello, welcome to this ETH/USDT update by CRYPTO SANDERS.
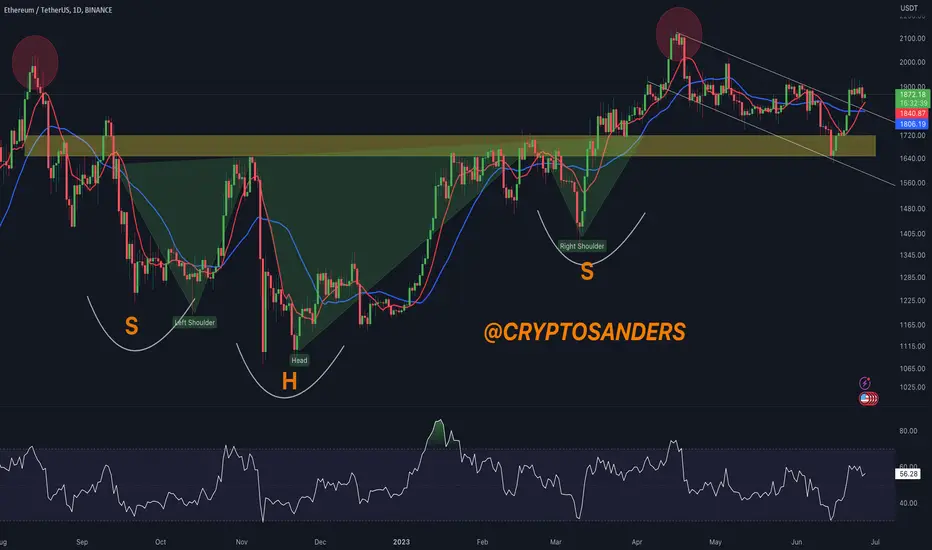
CHART ANALYSIS:- Ethereum (ETH), for its part, was unable to remain above a key price level of 1,900 during Monday’s session.
Following a high of 1,920.08 on Sunday, ETH/USD dropped by 2% today, hitting a bottom of 1,870.30 in the process.
The cryptocurrency has since marginally rebounded, and as of writing is trading at 1,882.04.
A key reason for the turbulence remains the fact that price strength has been unable to move past a ceiling of 61.00.
momentum in ethereum has turned bearish following a failed attempt to move above a ceiling of $1,930.
the RSI fell below a floor at 58.00, with a current reading of 57.75.
I have tried to bring the best possible outcome to this chart.
Hit the like button if you like it and share your charts in the comments section.
Thank you
CHART ANALYSIS:- Ethereum (ETH), for its part, was unable to remain above a key price level of 1,900 during Monday’s session.
Following a high of 1,920.08 on Sunday, ETH/USD dropped by 2% today, hitting a bottom of 1,870.30 in the process.
The cryptocurrency has since marginally rebounded, and as of writing is trading at 1,882.04.
A key reason for the turbulence remains the fact that price strength has been unable to move past a ceiling of 61.00.
momentum in ethereum has turned bearish following a failed attempt to move above a ceiling of $1,930.
the RSI fell below a floor at 58.00, with a current reading of 57.75.
I have tried to bring the best possible outcome to this chart.
Hit the like button if you like it and share your charts in the comments section.
Thank you

相關出版品
免責聲明
這些資訊和出版物並非旨在提供,也不構成TradingView提供或認可的任何形式的財務、投資、交易或其他類型的建議或推薦。請閱讀使用條款以了解更多資訊。